Markets rarely give us clear skies, and there are always threats to watch for on the horizon, but the right preparation, context, and support can help us navigate anything that may lie ahead. So far, this year hasn’t seen a full-blown crisis like 2008–2009 or 2020, but the ride has been very bumpy. We may not be flying into a storm, but there’s been plenty of volatility the first part of 2022. How businesses, households, and central banks steer through the rough air will set the tone for markets over the second half of 2022.
This week’s commentary includes excerpts from Midyear Outlook 2022: Navigating Turbulence
In the midst of the storm
A global economy that was already vulnerable to inflation from supply chain disruptions, tight labor markets, excess stimulus, and loose monetary policy came under more pressure when Russian aggression in Ukraine added sharply rising commodity prices and put Europe on the brink of recession. The effects have included renewed pressure on interest rates, which hurt bond investors and contributed to tightening financial conditions and a much more aggressive stance by the Federal Reserve (Fed) and other global central banks. Add in the typical market challenges of a midterm election year and the third year of a bull market, and it’s not surprising it’s been a bumpy ride.
Understandably, rising prices, slowing economic growth, and a challenging first half for both stocks and bonds have many investors on edge, and fatigue from more than two years of COVID-19 measures doesn’t make it any easier. But markets are always forward looking, so it’s important to remain focused on what lies ahead. There will most certainly be challenges, but there are also some tailwinds from a strong job market, still resilient businesses, and the likelihood that inflation rates will eventually slow. Markets historically can even get a little lift from lower uncertainty around elections as midterms approach.
Several factors causing volatility
Stocks faced many challenges in the first half of the year. At the top of the list were rampant fears of recession as the Fed began to pull back monetary policy support and pushed interest rates higher to combat high inflation. The Fed’s track record of fighting inflation without causing a recession is not reassuring. More often than not, its rate hiking campaigns have preceded (or caused) recessions—though typically at interest rates above current levels. Nonetheless, high inflation has been a common ingredient in recessions since WWII—see the 1970s, early 1980s, early 1990s, and even 2008. Add to that, an unexpected war in Eastern Europe and lingering—though diminishing—effects of COVID-19 on global supply chains, and the skies are far from clear.
Easing inflation pressure is key
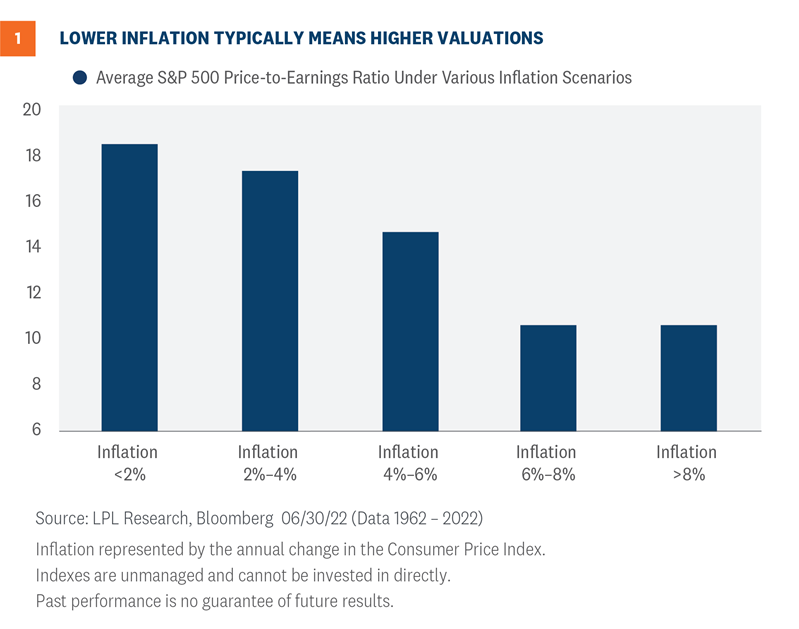
The amount of time it takes for stocks to return to prior highs will be largely determined by the path of inflation. LPL Research expects perhaps 1.5 percentage points to come off of core consumer prices by year-end—the latest reading for the Fed’s preferred inflation measure, the Core Personal Consumption Expenditures (PCE) Index excluding food and energy for May, was 4.7%. Lower inflation tends to bring higher valuations (Fig.1). The market clearly does not expect 8 – 9% inflation to persist based on current stock valuations, but whether inflation eventually settles at 3% or 4% will go a long way toward determining how much higher stock valuations can go from current levels.
If the U.S. can eke out some economic growth in the second half as inflation falls and recession fears subside, we would expect valuations to get a nice lift by year-end. But will profit margins be a drag? Current margins may support above-average valuations, but cost pressures remain intense as inflation has been stubbornly slow to come down. Labor markets are still tight. Commodity prices are still elevated even though some commodity prices recently declined. Supply chains are improving but remain a challenge, keeping prices for certain inputs elevated. Revenue growth is expected to slow with the economy, leaving less cushion for companies to hit their margin targets. These potential headwinds to profitability may make it difficult for corporate America to maintain its current high-single-digit earnings growth pace, but our base case calls for steady earnings gains through 2023.
Historical impact of midterms on markets
One of the things we knew coming into this year was that 2022 will be a midterm year—and those have historically not been kind to stocks. In fact, since 1950, midterm years have seen the largest peak-to-trough pullback of the four years of the presidential cycle, with the S&P 500 Index down 17.1% on average during the year (the max drawdown this year for the S&P 500 has been 23.5%, as of July 15). The good news is, one year off those lows, stocks have been up more than 32% on average.
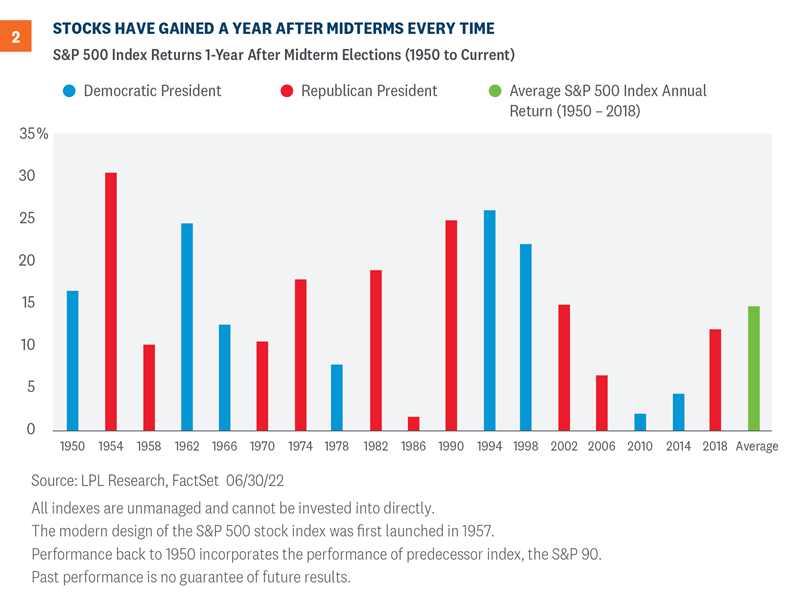
The year after midterm elections has historically been quite strong for stocks. Incredibly, the S&P 500 has been higher a year after every midterm election since 1950. That is 18 out of 18 years, with the average gain a year later of 14.5% (Fig. 2). Breaking it down by presidential party doesn’t show much difference, up 14.8% under a Republican and 14.5% under a Democrat.
Less uncertainty, divided government often preferred
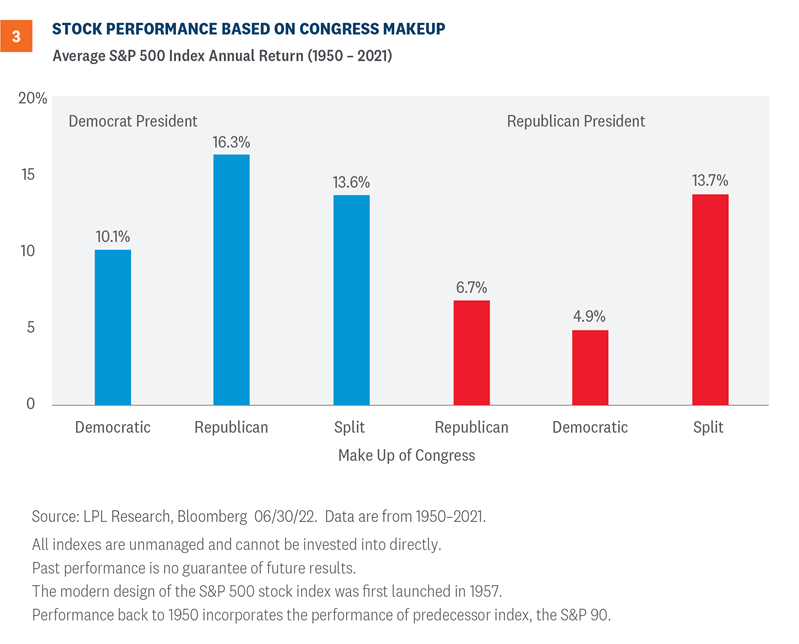
Markets hate uncertainty and we know that midterm elections can bring with them a good deal of uncertainty. What could it mean if history repeats and the Republicans take over both the House and Senate this coming November? Well, one of the best scenarios under a Democratic President is Republican control of Congress, with the S&P 500 up an average of 16.3% during those years—hard for investors to ignore. What if the Democrats hold onto the Senate, but lose the House (the second most likely scenario)? That combination has also been quite strong for stocks historically, with the S&P 500 gaining 13.6% on average during those years (Fig. 3).
Either way, it looks like divided government is in the cards, which markets have historically liked. That may be because neither party is able to give in to its worst excesses, because the parties are forced to find common ground, or possibly because little gets done and sometimes the government that governs best is the one that governs least.
Conclusion
As we try to orient ourselves to what may lie ahead in 2022, it can be hard to get our bearings, especially when we feel buffeted about by forces that are either unusual or that we haven’t experienced in some time. We are still dealing with COVID-19-related economic disruptions. Inflation is at its highest level in decades, central banks are trying to figure out how to unwind more than a decade of extraordinary monetary support, and two European countries are at war. All of these forces are having a real impact on businesses, consumers, and financial markets.
As we look at our potential landing point for 2022, the environment remains challenging and the growth outlook has unquestionably weakened. But there are also positives. Households, on average, still have deep reserves, and the job market remains stable. Businesses are feeling margin pressure but are also adapting to the shifting environment with help from strong balance sheets. Stock and bond valuations have become much more reasonable, and even, in places, historically low. Potentially helping things along, some historical patterns relating to midterm years, the election, and seasonality may even offer support toward the end of the year.
IMPORTANT DISCLOSURES
This material is for general information only and is not intended to provide specific advice or recommendations for any individual. There is no assurance that the views or strategies discussed are suitable for all investors or will yield positive outcomes. Investing involves risks including possible loss of principal. Any economic forecasts set forth may not develop as predicted and are subject to change.
References to markets, asset classes, and sectors are generally regarding the corresponding market index. Indexes are unmanaged statistical composites and cannot be invested into directly. Index performance is not indicative of the performance of any investment and does not reflect fees, expenses, or sales charges. All performance referenced is historical and is no guarantee of future results.
Any company names noted herein are for educational purposes only and not an indication of trading intent or a solicitation of their products or services. LPL Financial doesn’t provide research on individual equities.
All information is believed to be from reliable sources; however, LPL Financial makes no representation as to its completeness or accuracy.
U.S. Treasuries may be considered “safe haven” investments but do carry some degree of risk including interest rate, credit, and market risk. Bonds are subject to market and interest rate risk if sold prior to maturity. Bond values will decline as interest rates rise and bonds are subject to availability and change in price.
The Standard & Poor’s 500 Index (S&P500) is a capitalization-weighted index of 500 stocks designed to measure performance of the broad domestic economy through changes in the aggregate market value of 500 stocks representing all major industries.
The PE ratio (price-to-earnings ratio) is a measure of the price paid for a share relative to the annual net income or profit earned by the firm per share. It is a financial ratio used for valuation: a higher PE ratio means that investors are paying more for each unit of net income, so the stock is more expensive compared to one with lower PE ratio.
Earnings per share (EPS) is the portion of a company’s profit allocated to each outstanding share of common stock. EPS serves as an indicator of a company’s profitability. Earnings per share is generally considered to be the single most important variable in determining a share’s price. It is also a major component used to calculate the price-to-earnings valuation ratio.
All index data from FactSet.
Personal consumption expenditures (PCE) is a measure of price changes in consumer goods and services released monthly by the Bureau of Economic Analysis (BEA). Personal consumption expenditures consist of the actual and imputed expenditures of households; the measure includes data pertaining to durables, nondurables, and services. It is essentially a measure of goods and services targeted toward individuals and consumed by individuals.
This research material has been prepared by LPL Financial LLC.
Securities and advisory services offered through LPL Financial (LPL), a registered inv estment advisor and broker -dealer (member FINRA/SIPC). Insurance products are offered through LPL or its licensed affiliates. To the extent you are receiving investment a dvice from a separately registered independent investment advisor that is not an LPL affiliate, please note LPL makes no representation with respect to such entity.
| Not Insured by FDIC/NCUA or Any Other Government Agency | Not Bank/Credit Union Guaranteed | Not Bank/Credit Union Deposits or Obligations | May Lose Value |
RES-1215950-0722 | For Public Use | Tracking # 1-05305273 (Exp. 07/23)