The LPL Research Strategic and Tactical Asset Allocation Committee is increasing its recommended interest rate exposure in its tactical allocation from underweight to neutral. Now that interest rates have moved substantially higher, we believe opportunities in fixed income have improved and are looking to add back to certain areas within fixed income that may benefit.
Because the equity risk within our diversified asset allocation portfolios is still the largest contributor to total portfolio risk, we like the defensive properties that bonds could play on a go-forward basis. In the form of high-quality bonds, interest rate exposure has been a good diversifier to equity risk. And while that hasn’t been the case this year, we think at these higher interest rate levels, bonds can act like that diversifier again. While we acknowledge that interest rates could move higher still, we think the risk/reward profile of adding to rate-sensitive fixed income assets has improved. That said, for those income-oriented investors who mostly or exclusively hold bonds and don’t need fixed income to diversify stock holdings, we think there are ample opportunities in shorter maturity Treasury and investment-grade corporate securities.
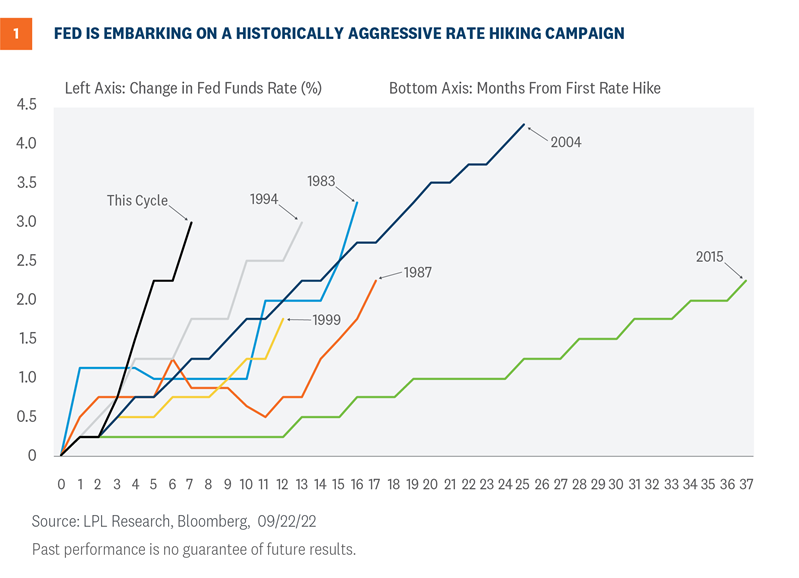
A Historically Aggressive Fed
In last week’s Weekly Market Commentary, we wondered how much higher interest rates could go. The yield on the 10-year U.S. Treasury yield is up over 3.0% from its August 2020 lows and has already seen the biggest move higher in yields since 1987, when rates moved higher by 3.2%. Since the 1980s, the average trough-to-peak increase in 10-year Treasury yields has been closer to 2.5%, but that includes large rate increases in the early ‘80s when Treasury yields were much higher. Since 2000, the average increase in the 10-year yield during major moves higher is around 1.8%. Clearly, we’re not in normal times, but the move on the 10-year Treasury yield since it bottomed in August 2020 has been significant. As such, yields on most fixed income instruments are trading above longer-term averages.
The significant increase in yields, especially this year, is because of changing Federal Reserve (Fed) rate hike expectations. In late 2021, markets expected the Fed to largely stay on the sidelines and keep short-term interest rates low. However, as inflationary pressures remained (and still remain), the Fed has embarked on a historically aggressive rate hiking campaign [Figure 1]. Because of the Fed’s stated desire to front-load rate hikes, the current rate hiking cycle is the most aggressive campaign since the early ‘80s in both the speed and magnitude of rate hikes. The Fed has signaled that more interest rate hikes will likely be necessary to arrest the generationally high consumer price increases we’re currently experiencing. Markets have already priced in what we think is an appropriate terminal fed funds rate. As such, we think we may be at or near peak “hawkishness” from the Fed, which should allow fixed income yields to stabilize at or near current levels.
A Deeply Inverted Yield Curve
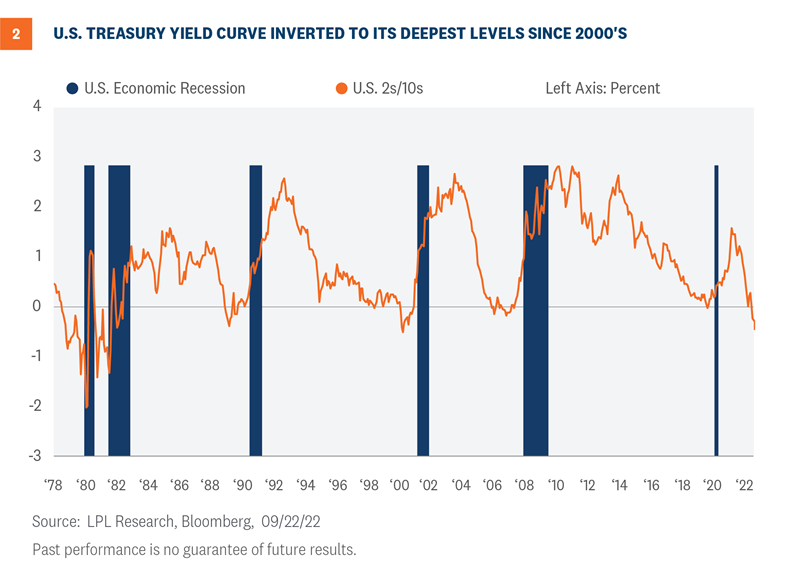
At last week’s Fed meeting, Fed Chairman Jerome Powell all but abandoned the prospects of a soft or softish landing. He reiterated the Fed’s resolve in continuing to raise interest rates and keep them at these higher levels until the inflationary pressures subside. As we know from historical precedents, when the Fed aggressively raises rates, economic growth slows or outright contracts, which is the Fed’s goal. And as seen on Figure 2, yield curve inversion (when shorter maturity Treasury securities out-yield longer-maturity Treasury securities) tends to act like a market signal that the probability of a recession has increased. At current levels, yield curve inversion is the deepest it’s been since the 2000s. While we still think the consumer is in better shape than during previous Fed rate hiking campaigns, we do think the prospects of a recession have increased for 2023. High quality bonds tend to perform relatively well during economic slowdowns and/or contractions.
Core vs Core Plus Bond Implementation
To take advantage of these higher yields and to reduce our underweight to interest rate sensitive assets within our diversified asset allocation portfolios, our preferred approach is to allocate to a core bond fund or ETF. We believe a core bond fund (versus a core plus or multi-sector bond fund) provides more reliable ballast to equity positioning while also being able to take advantage of higher yields.
The intermediate core bond and core plus bond categories represent the two most popular categories by assets under management (AUM) and represent 45% of all asset across the taxable bond open-ended mutual fund space (as of August 2022). But what’s the difference between core and core plus? What does “plus” really mean? In simplest terms, “plus” indicates a more flexible investment mandate across fixed income markets. Core plus bond funds have more latitude to invest in out-of-benchmark (i.e., Bloomberg US Aggregate Index, “Aggregate index”) sectors, in lower quality bonds, and often have more discretion to make meaningful rate calls relative to the index.
Core plus bond funds often have more exposure to emerging market bonds, developed international bonds, high-yield credit, and securitized credit. This results in less exposure to U.S. Treasuries, agency mortgages, and investment-grade corporate bonds that comprise the Aggregate index. While both core and core plus funds focus on investment grade (IG) rated bonds, by definition, core bond funds hold less than 5% of net assets in below IG rated bonds (on average, less than 2% over the last 36 months). Core plus funds typically have the flexibility to hold well above that 5% threshold (over 20% in sub-IG is not uncommon).
Analyzing monthly statistics over the trailing 36 months for both core and core plus bond funds, core plus bond funds have a higher standard deviation, meaning core plus bond funds tend to be more volatile. Part of that volatility comes from a more actively managed interest rate process, which may result in larger divergences from the index. Additional volatility comes from owning fixed income sectors that may act like equities during economic slowdowns. By contrast, core bond funds generally offer diversified bond exposure that more closely tracks the Aggregate index, which is the index that has historically held diversifying properties to offset equity risks.
Conclusion
This year will go down as the worst year for bonds in the history of the Aggregate bond index, but with higher yields, we think the prospects for fixed income have improved. Not only have the income opportunities increased, we think the diversifying properties of bonds have increased as well. Clearly, bond diversification has not worked this year. But, with the Fed committed to staving off continuing inflationary pressure—even at the expense of an economic contraction—we think bonds have the opportunity to act like bonds again and provide the ballast for equities within a diversified asset allocation. As such, the Strategic and Tactical Asset Allocation Committee here at LPL Research has recently voted to neutralize the interest rate sensitivity in our bond portfolios, relative to our indexes, to take advantage of higher yields.
Lawrence Gillum, CFA, Fixed Income Strategist, LPL Financial
Josh Whitmore, CFA, Sr. Fixed Income Analyst, LPL Financial
You may also be interested in:
- How Much Higher Can Rates Go? – September 19, 2022
- Getting Jobs Market Back into Balance – September 12, 2022
- September’s Calendar Cruelty for Stocks – September 6, 2022
IMPORTANT DISCLOSURES
This material is for general information only and is not intended to provide specific advice or recommendations for any individual. There is no assurance that the views or strategies discussed are suitable for all investors or will yield positive outcomes. Investing involves risks including possible loss of principal. Any economic forecasts set forth may not develop as predicted and are subject to change.
References to markets, asset classes, and sectors are generally regarding the corresponding market index. Indexes are unmanaged statistical composites and cannot be invested into directly. Index performance is not indicative of the performance of any investment and do not reflect fees, expenses, or sales charges. All performance referenced is historical and is no guarantee of future results.
Any company names noted herein are for educational purposes only and not an indication of trading intent or a solicitation of their products or services. LPL Financial doesn’t provide research on individual equities.
All information is believed to be from reliable sources; however, LPL Financial makes no representation as to its completeness or accuracy.
US Treasuries may be considered “safe haven” investments but do carry some degree of risk including interest rate, credit, and market risk. Bonds are subject to market and interest rate risk if sold prior to maturity. Bond values will decline as interest rates rise and bonds are subject to availability and change in price.
The Standard & Poor’s 500 Index (S&P500) is a capitalization-weighted index of 500 stocks designed to measure performance of the broad domestic economy through changes in the aggregate market value of 500 stocks representing all major industries.
The PE ratio (price-to-earnings ratio) is a measure of the price paid for a share relative to the annual net income or profit earned by the firm per share. It is a financial ratio used for valuation: a higher PE ratio means that investors are paying more for each unit of net income, so the stock is more expensive compared to one with lower PE ratio.
Earnings per share (EPS) is the portion of a company’s profit allocated to each outstanding share of common stock. EPS serves as an indicator of a company’s profitability. Earnings per share is generally considered to be the single most important variable in determining a share’s price. It is also a major component used to calculate the price-to-earnings valuation ratio.
All index data from FactSet.
This research material has been prepared by LPL Financial LLC.
Securities and advisory services offered through LPL Financial (LPL), a registered inv estment advisor and broker -dealer (member FINRA/SIPC). Insurance products are offered through LPL or its licensed affiliates. To the extent you are receiving investment a dvice from a separately registered independent investment advisor that is not an LPL affiliate, please note LPL makes no representation with respect to such entity.
Not Insured by FDIC/NCUA or Any Other Government Agency | Not Bank/Credit Union Guaranteed | Not Bank/Credit Union Deposits or Obligations | May Lose Value
RES-1277500-0922 | For Public Use | Tracking # 1-05330374 (Exp. 09/23)