The script has been flipped in 2023. Last year’s underperformers have turned into outperformers this year, driving the S&P 500 Index up over 5% this month. The pace and composition of the rally have left many investors skeptical over its sustainability, especially amid a lackluster earnings season thus far. Of course, the market is also forward-looking, with expectations for falling inflation and a less hawkish Federal Reserve (Fed) as we progress into 2023. And although the trajectory of the rally will likely slow, seasonal indicators point to a path higher for U.S. equity markets by year-end.
For background, market seasonality is premised on the adage of ‘history doesn’t repeat, but it often rhymes.’ The embedded assumption is the market exhibits seasonal patterns or cycles that ‘rhyme’ throughout history, or more specifically, when prices move in a recognizable pattern that occurs with some degree of consistency over a specific timeframe. These patterns can last anywhere from several days to several years, each having its own tendencies unique to that period. For example, we are now in year three of the presidential cycle, historically the best-performing year for stocks across the four-year cycle. By no means is seasonality flawless, as pricing patterns are historical tendencies and not a guarantee of future results. Within LPL Research, we view seasonal data as one input, among many, into our decision-making process.
When various seasonal indicators tell the same story, the message becomes more powerful. The market is now on the cusp of receiving one of these ‘messages’ by potentially hitting a trifecta of seasonal indicators this month.
What are the components of the trifecta?
- Santa Claus Rally: This seasonal pattern was first discovered by Yale Hirsch in 1972. Hirsch, the creator of the popular Stock Trader’s Almanac, defined the period as the last five trading days of the year plus the first two trading days of the new year. A positive Santa Claus rally signal occurs when the S&P 500 posts a positive return during this timeframe. For 2023, the S&P 500 was up 0.8% during this period, checking the box for a positive signal.
- First Five Days: Hirsch also created the First Five Days indicator. This indicator is considered a warning system for the year ahead when the first five days of the year are negative. The S&P 500 finished the first five days of 2023 up 1.4%, checking the box for a positive First Five Days signal.
- January Barometer: Last but not least, Hirsch also created the January Barometer indicator and its popular tagline of ‘As goes January, so goes this year’ (positive January returns are historically associated with positive annual returns). A positive January Barometer indicator occurs when the S&P 500 posts a positive return in January. With the S&P 500 up over 5% this month as of Friday, January 27, a positive signal is expected.
When all three of these indicators are positive, such as this year, the January Trifecta has been hit (credit for the Trifecta indicator goes to Jeff Hirsch, Yale’s son who has continued his Stock Trader’s Almanac work).
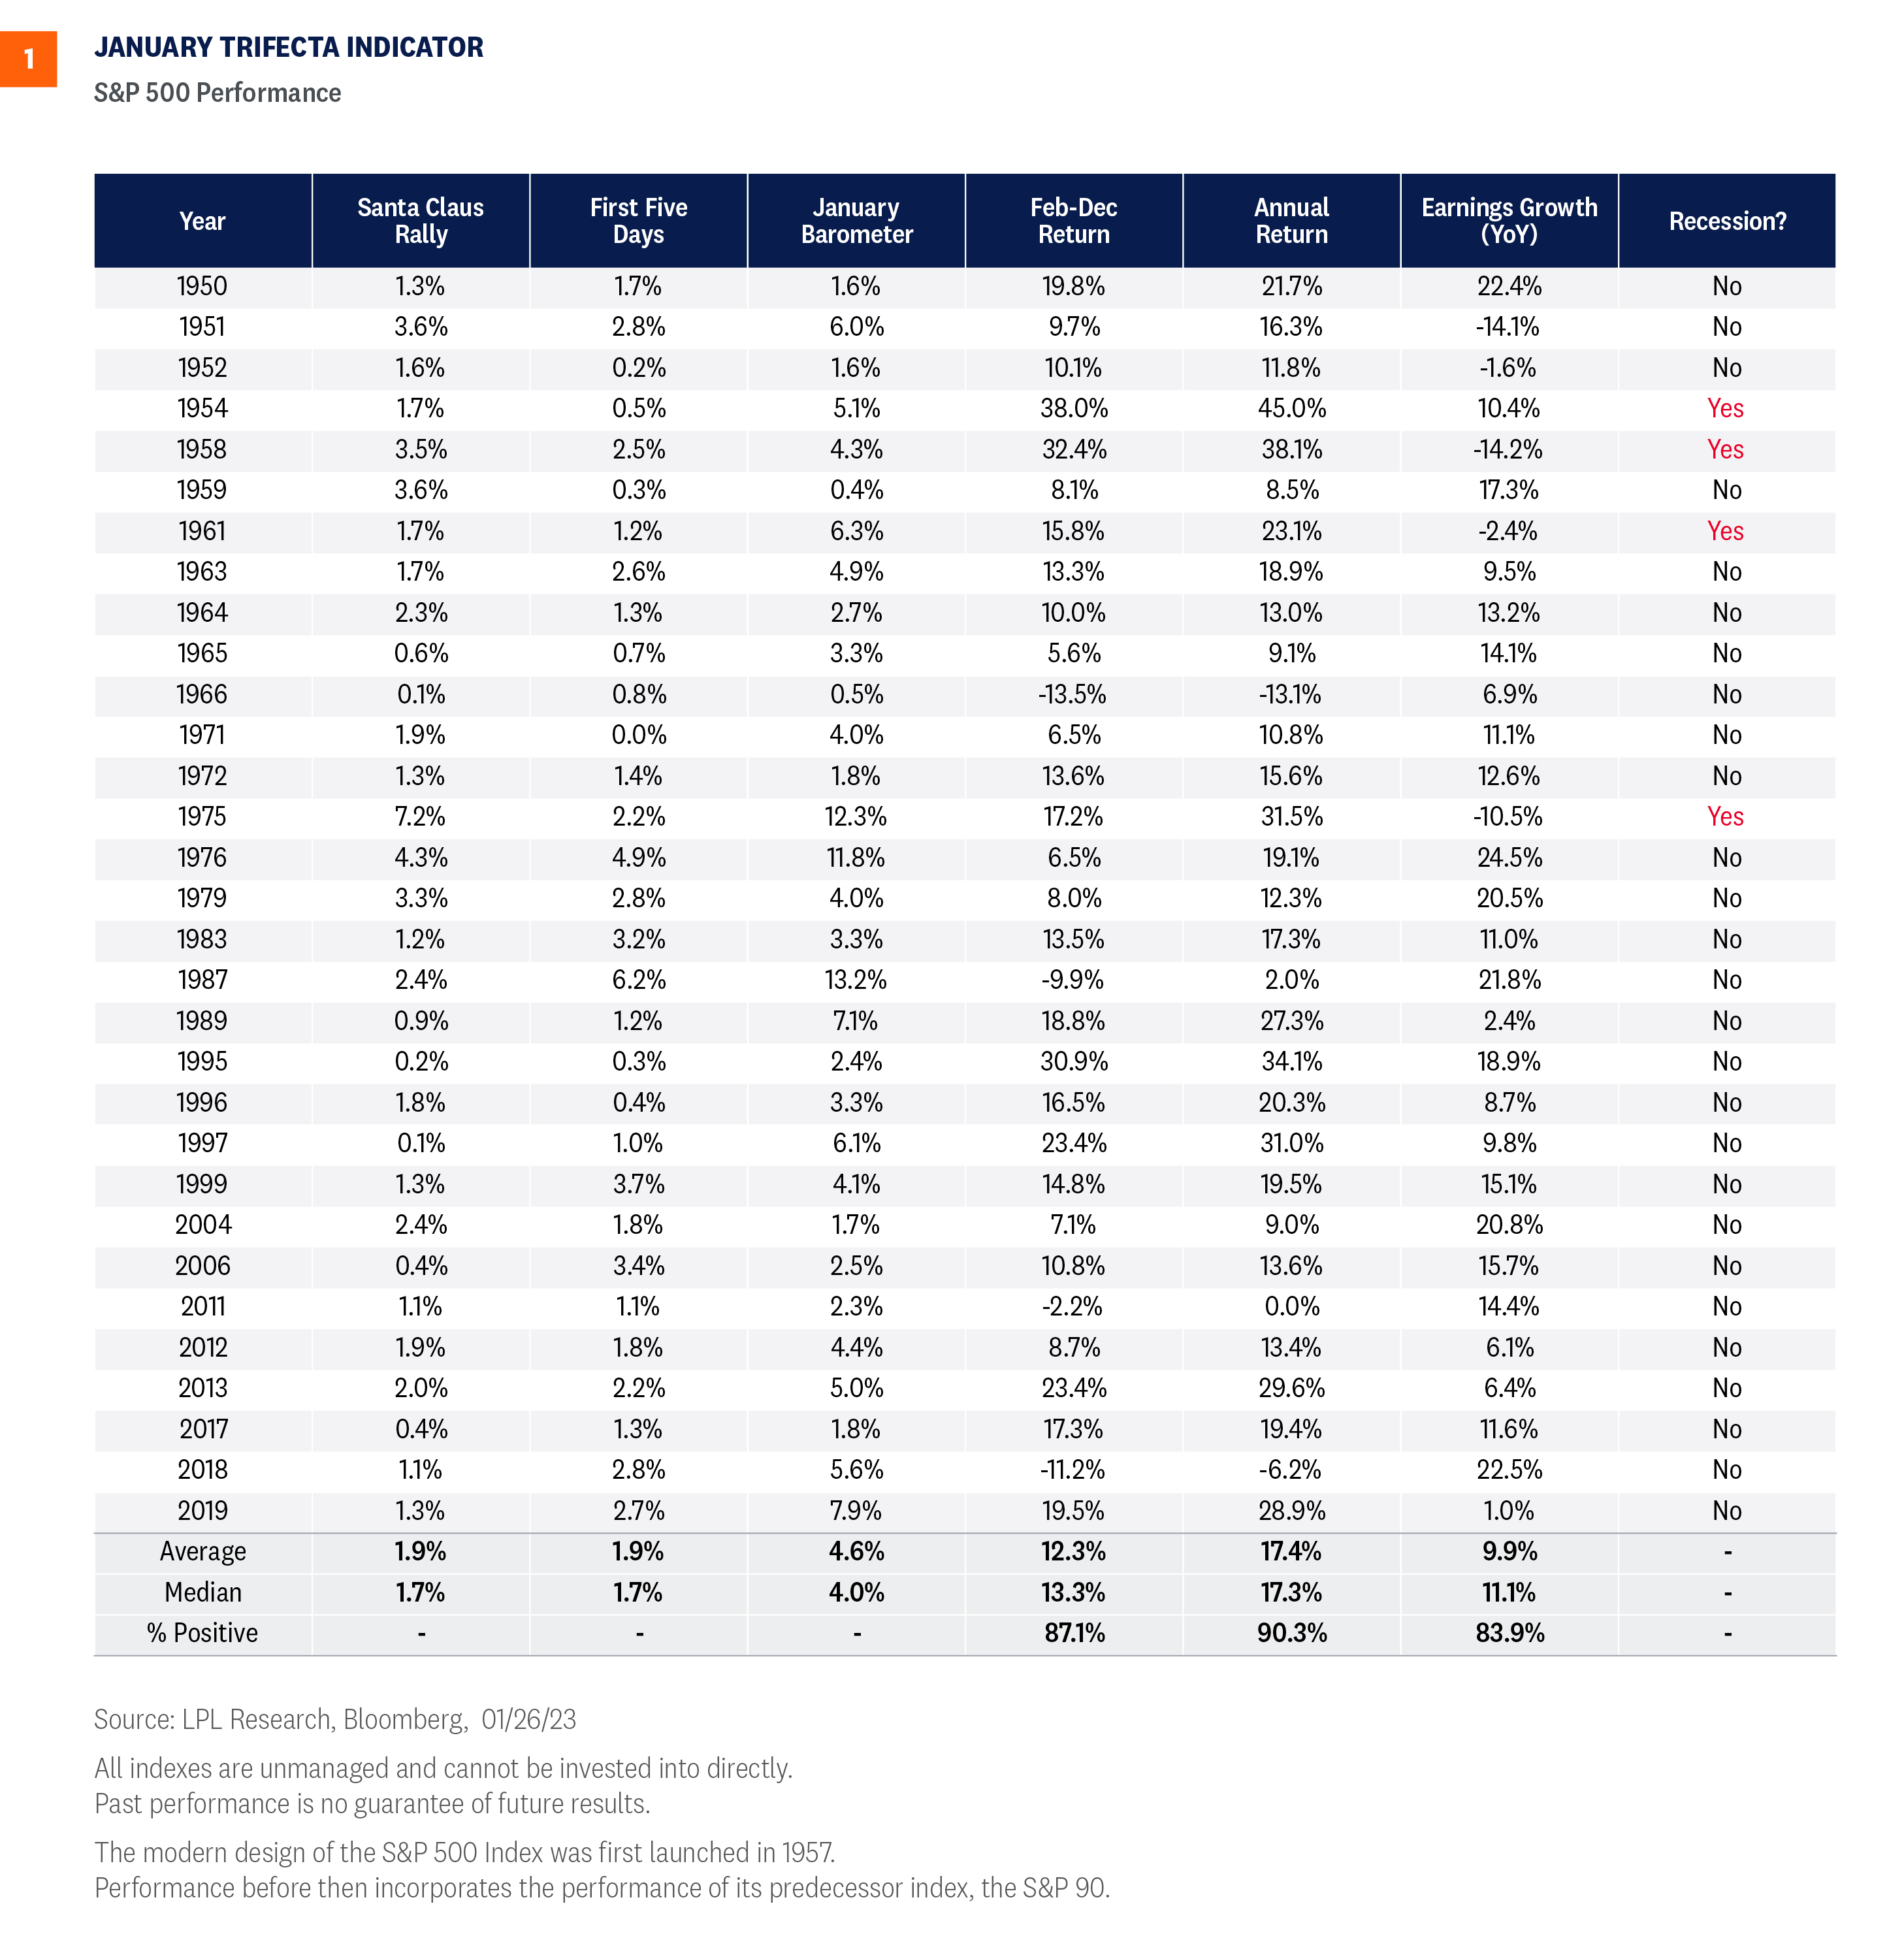
Figure 1 highlights various return metrics for years when the trifecta indicator was hit for the S&P 500. For additional context, we also included year-over-year earnings growth for the index, along with whether or not the year included a recession.
Key Takeaways:
As you can see in the chart, the trifecta accomplished this month has historically led to some very strong returns. The S&P 500 has on average added 12.3% to a 4.6% January gain between February and December, bringing the average gain for these years to over 17%. This sounds like a big gain, and it is, but keep in mind the average gain in the third year of the four-year presidential cycle is 16.8%, and the average year following a down year is up 15%.
It also worth noting that with the broad market slipping nearly 20% last year, this gain still would not get the market back to the 2022 high set on January 3, 2022. Stocks enter 2023 much more attractively valued than a year ago—roughly 18 times forward (2023) earnings as compared to over 21 times forward (2022) earnings a year ago, based on FactSet estimates.
Steady Path to Gains
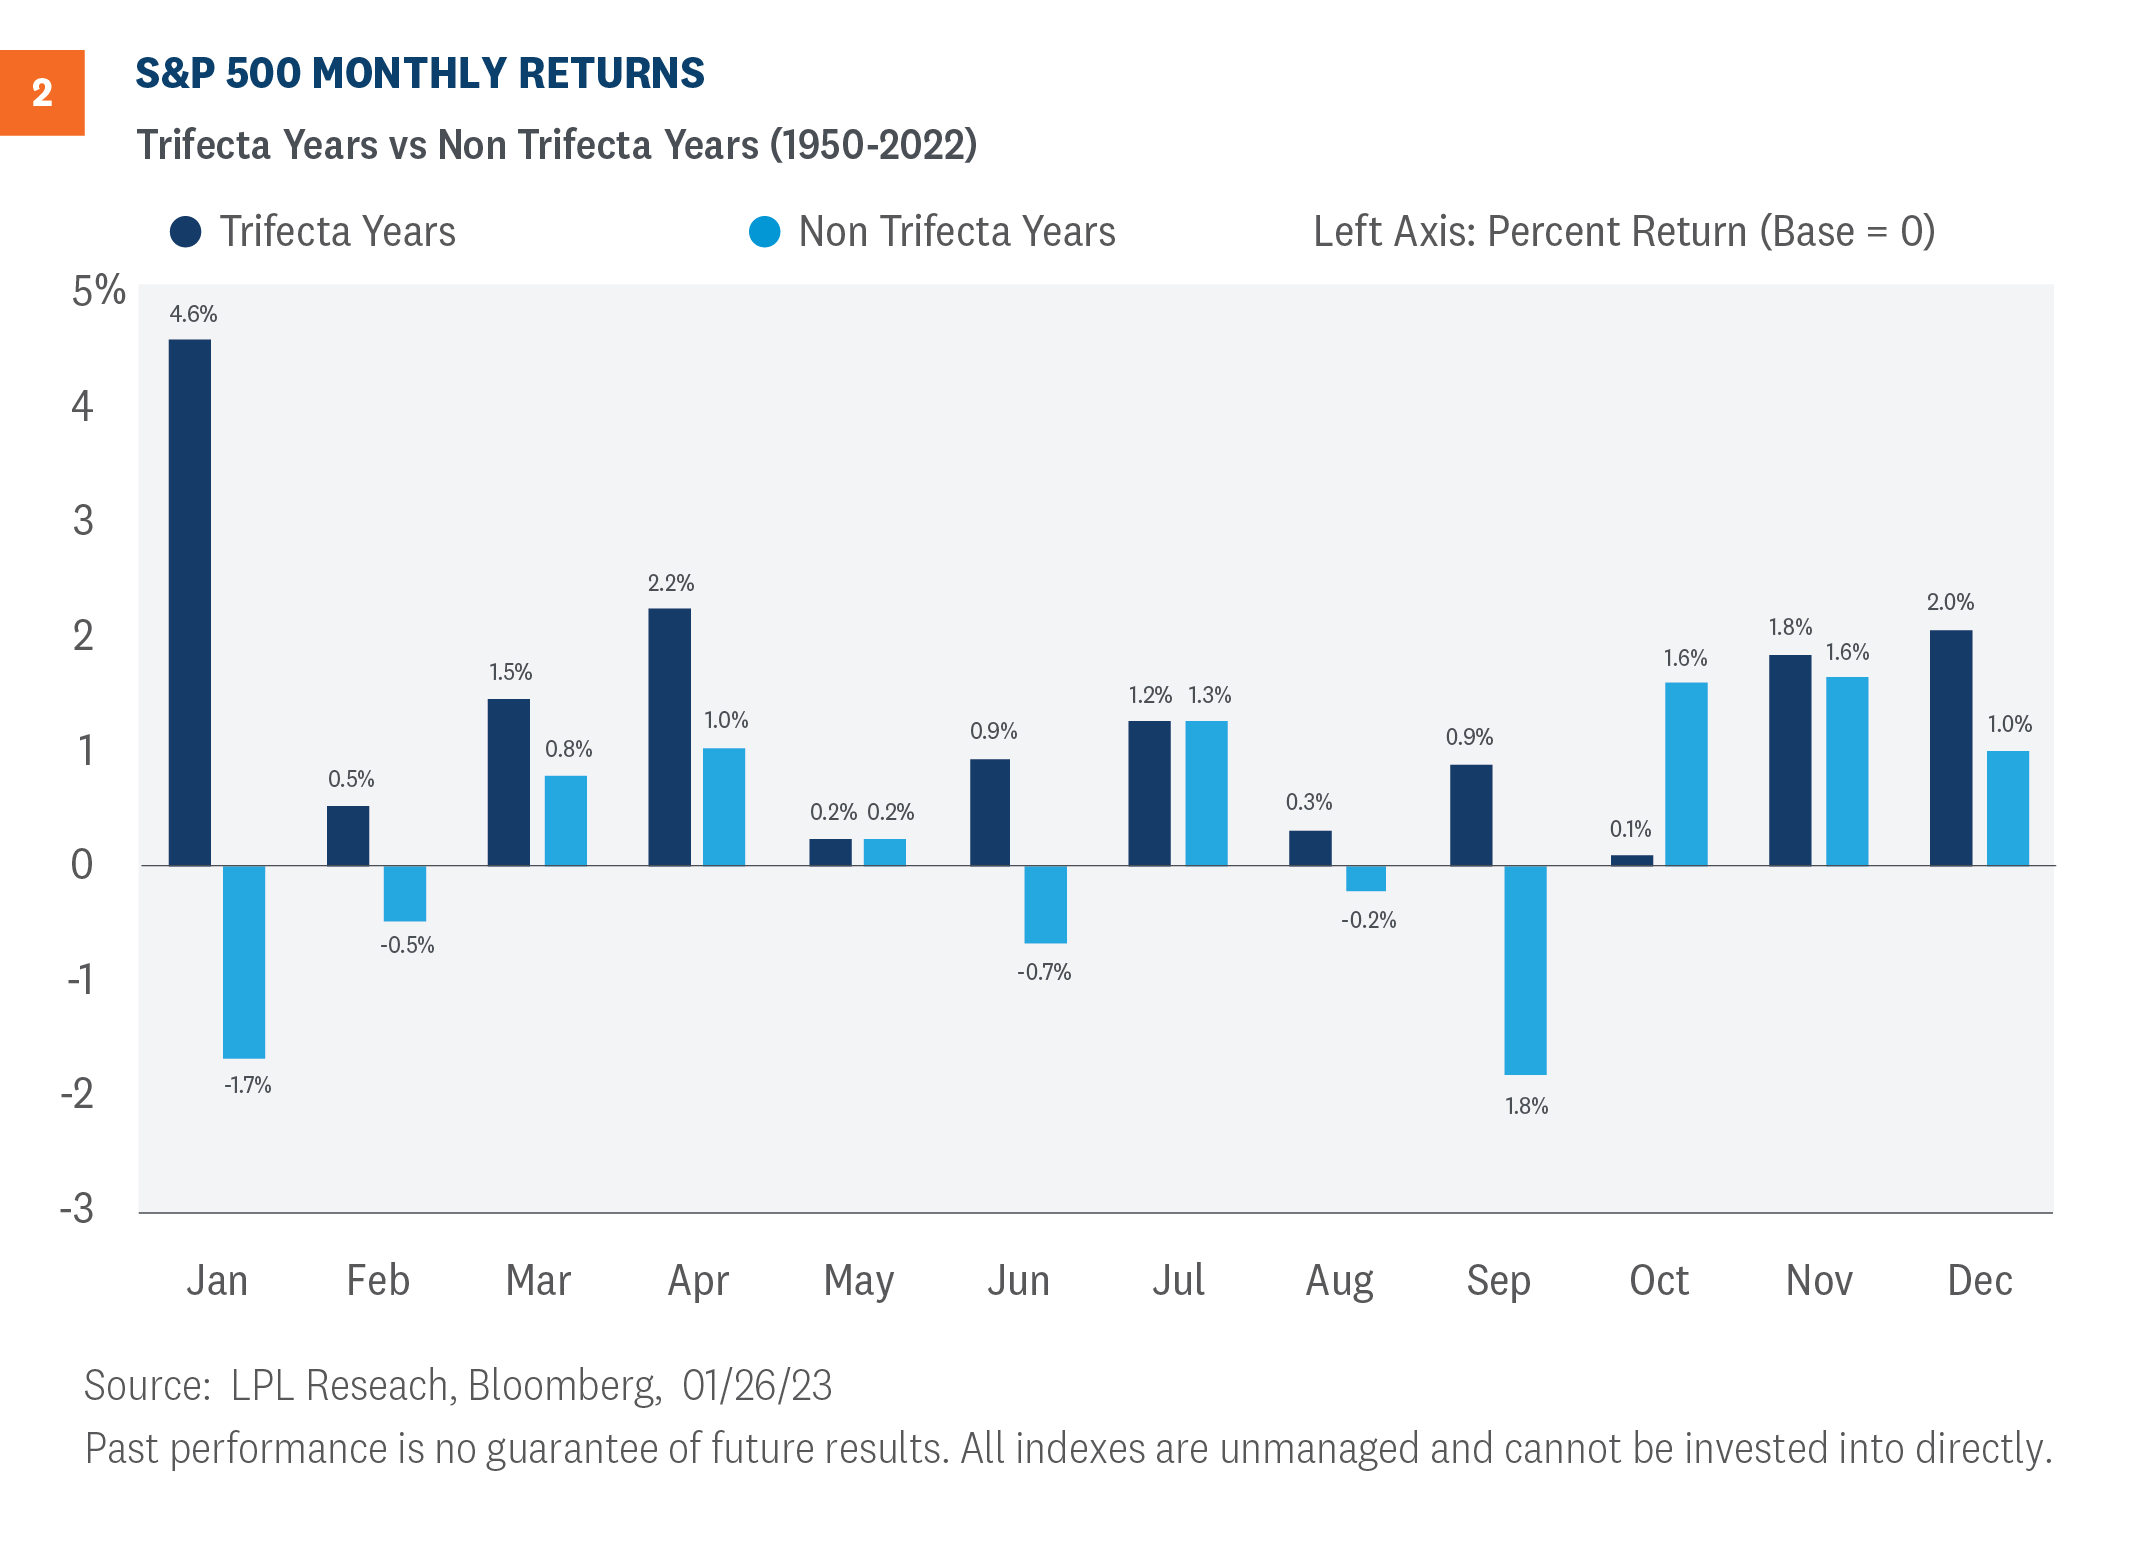
Finally, we also compared the monthly seasonality for trifecta years and non-trifecta years. Figure 2 highlights the returns across each scenario. While the strong January average returns during trifecta years decelerate in February, they do not historically turn negative. In fact, of the 31 trifecta years observed, all 12 months produced positive average monthly returns.
Conclusion
Stocks continue to climb the wall of worry despite mixed messages between technicals and fundamentals. Seasonality indicators, including the trifecta indicator, suggest the path of least resistance for the broader market is likely higher for the year ahead. And while the seasonality message is clear, the market still needs catalysts to climb higher. LPL Research believes the end of the Fed’s monetary policy tightening will be a key driver for stocks this year. Cooling inflation data will not only underpin a policy change, but also reduce headwinds for companies battling ongoing pricing pressures. The end of a rate hike cycle could also mean interest rate stabilization or even lower interest rates, another potential driver of equity market gains. Finally, while we believe recession risk remains high, there is the chance the U.S. economy is only facing a growth scare and muddles through on the back of a resilient consumer who is flush with cash.
Adam Turnquist, CMT, Chief Technical Strategist, LPL Financial
Jeffrey Buchbinder, CFA, Chief Equity Strategist, LPL Financial
You may also be interested in:
- A Feisty Bull-Bear Debate: Weighing the Pros and Cons – January 23, 2023
- Q4 Earnings Preview: Pessimism May Be Overdone – January 17, 2023
- Market, Stocks, and Bonds Lessons Learned from 2022 – January 9, 2023
IMPORTANT DISCLOSURES
This material is for general information only and is not intended to provide specific advice or recommendations for any individual. There is no assurance that the views or strategies discussed are suitable for all investors or will yield positive outcomes. Investing involves risks including possible loss of principal. Any economic forecasts set forth may not develop as predicted and are subject to change.
References to markets, asset classes, and sectors are generally regarding the corresponding market index. Indexes are unmanaged statistical composites and cannot be invested into directly. Index performance is not indicative of the performance of any investment and do not reflect fees, expenses, or sales charges. All performance referenced is historical and is no guarantee of future results.
Any company names noted herein are for educational purposes only and not an indication of trading intent or a solicitation of their products or services. LPL Financial doesn’t provide research on individual equities.
All information is believed to be from reliable sources; however, LPL Financial makes no representation as to its completeness or accuracy.
All investing involves risk, including possible loss of principal.
US Treasuries may be considered “safe haven” investments but do carry some degree of risk including interest rate, credit, and market risk. Bonds are subject to market and interest rate risk if sold prior to maturity. Bond values will decline as interest rates rise and bonds are subject to availability and change in price.
The Standard & Poor’s 500 Index (S&P500) is a capitalization-weighted index of 500 stocks designed to measure performance of the broad domestic economy through changes in the aggregate market value of 500 stocks representing all major industries.
The PE ratio (price-to-earnings ratio) is a measure of the price paid for a share relative to the annual net income or profit earned by the firm per share. It is a financial ratio used for valuation: a higher PE ratio means that investors are paying more for each unit of net income, so the stock is more expensive compared to one with lower PE ratio.
Earnings per share (EPS) is the portion of a company’s profit allocated to each outstanding share of common stock. EPS serves as an indicator of a company’s profitability. Earnings per share is generally considered to be the single most important variable in determining a share’s price. It is also a major component used to calculate the price-to-earnings valuation ratio.
All index data from Bloomberg.
For a list of descriptions of the indexes and economic terms referenced in this publication, please visit our website at lplresearch.com/definitions.
This research material has been prepared by LPL Financial LLC.
Securities and advisory services offered through LPL Financial (LPL), a registered inv estment advisor and broker -dealer (member FINRA/SIPC). Insurance products are offered through LPL or its licensed affiliates. To the extent you are receiving investment a dvice from a separately registered independent investment advisor that is not an LPL affiliate, please note LPL makes no representation with respect to such entity.
Not Insured by FDIC/NCUA or Any Other Government Agency | Not Bank/Credit Union Guaranteed | Not Bank/Credit Union Deposits or Obligations | May Lose Value
RES-1407837-0123 | For Public Use | Tracking #1-05358210 (Exp. 01/24)