Last week did not play out how we anticipated. Coming into the week, it was all about Federal Reserve (Fed) Chair Jerome Powell’s congressional testimony and the February jobs report. Instead, we got a shockingly fast collapse of a financial institution with over $200 billion in assets, which turned the market’s focus toward the stability of the banking system and what systemic risks banks might be facing. This commentary is focused on our asset allocation views, but no doubt the Silicon Valley Bank saga will require more attention from investors in the days ahead.
Maintaining Recommended Equity Allocations Despite Latest Developments
A tough environment for asset allocators just got tougher with the events of the past few days. For the “no landing” crowd thinking strong consumer spending and low unemployment would keep this economy growing until the inflation fight is won, they now have to consider signs of stress in the banking system after the failure of SVB Financial (commonly known as Silicon Valley Bank). See the LPL Research blog for our latest thoughts on that situation.
The stock market bulls also had to absorb hawkish testimony from Fed Chair Powell that led the bond market to increase the chances of a 50 basis point rate hike on March 22 (though those expectations unwound following the SVB news). Add to that a troublesome last round of inflation data and the most inverted yield curve in four decades, based on 2- and 10-year Treasury bonds, and the bulls don’t have the firmest ground to stand on.
But this market has also made it tough for the bears to get it right. The cyclical, so-called “high beta” stocks have been outperforming—the late-week selloff in the banks notwithstanding. Double-digit gains from the October lows were accompanied by strong breadth—a sign of a healthy bull market with a broad range of stocks participating in the rally. Recent economic data has pointed to continued growth—giving rise to the “no landing” narrative. Earnings estimates have held up better than many expected. We’re in a very strong seasonal period for stocks, based on the four-year presidential cycle (year three has an average gain of 16.8%, higher 89% of the time since 1950). Fed pauses—likely coming fairly soon—have historically been followed by double-digit returns one year later, on average.
So the case for gains this year seems strong based on history, enough for the LPL Research Strategic and Tactical Asset Allocation Committee (STAAC) to continue to recommend an overweight equities position. However, the pressure on valuations from higher interest rates, which have made bonds attractive alternatives, led to the Committee’s recent decision to reduce the size of the overweight from 5 points to 3.
Not Enough Evidence to Switch Back to Growth
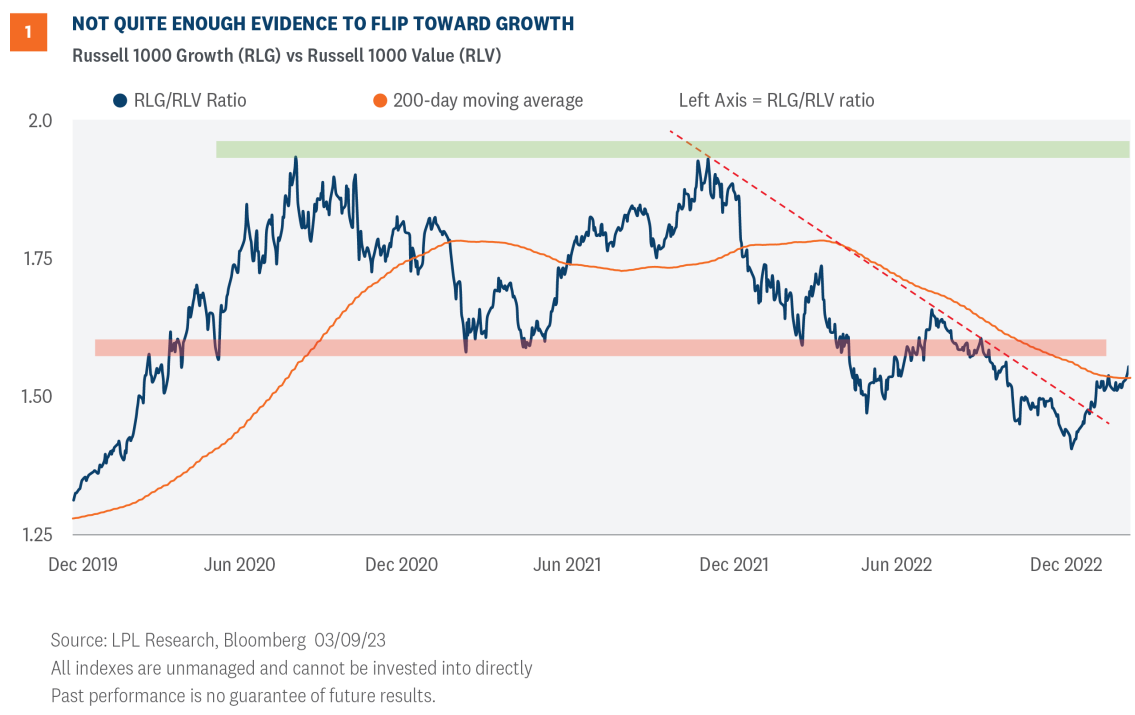
Growth stocks have come storming back in 2023 after significantly underperforming their value counterparts in 2022. The Russell 1000 Growth Index has returned 4.6% year to date, compared to the 2.3% decline for the value index. The question now is have growth stocks shown enough to reclaim leadership and sustain the outperformance.
Starting with the technical analysis picture, the improving relative strength has pushed the Russell 1000 Growth (RLG)/Russell 1000 Value (RLV) ratio chart back above its declining 200- day moving average. However, technically, the ratio chart has yet to recapture the lower end of its prior range and until that area of overhead resistance is cleared, we believe the sustainability of growth outperformance remains questionable (Figure 1).
From a fundamental perspective, the near-term outlook for the value style has gotten much tougher following the banking selloff last week. Financials are the biggest value sector, composing 20% of the Russell 1000 Value Index, compared with just 3% of the Growth Index.
But valuations strongly favor value over growth. Despite the strong 2022 for value in which the Russell 1000 Value Index outperformed the Growth Index by more than 20 percentage points, the Value Index still trades at a 38% discount to growth compared with the respective 10- and 20-year average discounts of 28% and 25%.
Other reasons the STAAC maintains a slight preference for value include the Committee’s favorable view of energy, which is the second biggest value sector, and value’s record of outperformance during rising interest rate and high inflation periods.
Small Cap Valuations Offer Some Cushion for Business Cycle Risks
Small caps would typically not be one that asset allocators would recommend when some of the most prescient leading economic indicators are sending strong recession signals. They tend to do better early in economic cycles once the economy emerges from recession. If the common— though not quite unanimous—view that recession may come in 2023 or early 2024 turns out to be right, then the sweet spot for small caps may be a year or more away.
But small caps have performed relatively well this year, despite the economic uncertainty. The S&P 600 small cap index has returned about 1.5% year to date, while the Russell 2000 Index is up 0.9%, after both lost more than 7.5% last week.
We would cite valuations as the primary reason small caps have held up amid concerns about stress in the banking system (which we do not see as systemic). The small cap indexes carry more financials than large caps, (about 8% more based on the Russell 2000 and S&P 500indexes) and generally companies’ balance sheets are not as strong.
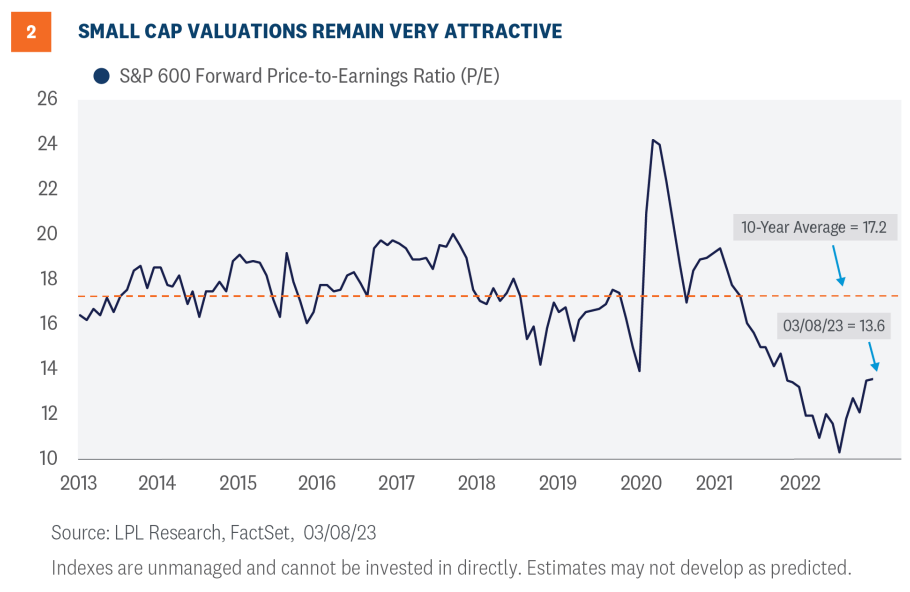
Small caps look cheap enough to us here to favor despite these risks. As shown in Figure 2, the S&P 600 Small Cap Index trades at a 13.6 price-to-earnings ratio (P/E), well below its 10- year average at 17.2. For comparison, the S&P 500 Index trades at a 17.2 P/E, right in line with its 10-year average.
The technical setup for large caps versus small caps, based on the ratio chart for the S&P indexes, remains in a downtrend and below its declining 200-day moving average, implying the trend still favors small cap outperformance ahead.
Developed International a Worthy Alternative to the United States
LPL Research’s outlook for developed international equities has improved in recent months. Based on the combination of improving technical analysis trends, attractive valuations, and resilient performance by European economies thanks to falling energy prices, the STAAC’s allocation to international has been increased to near that of U.S. equities. Specifically, the Committee recommends a neutral allocation to international and a 3-4% overweight to U.S. equities.
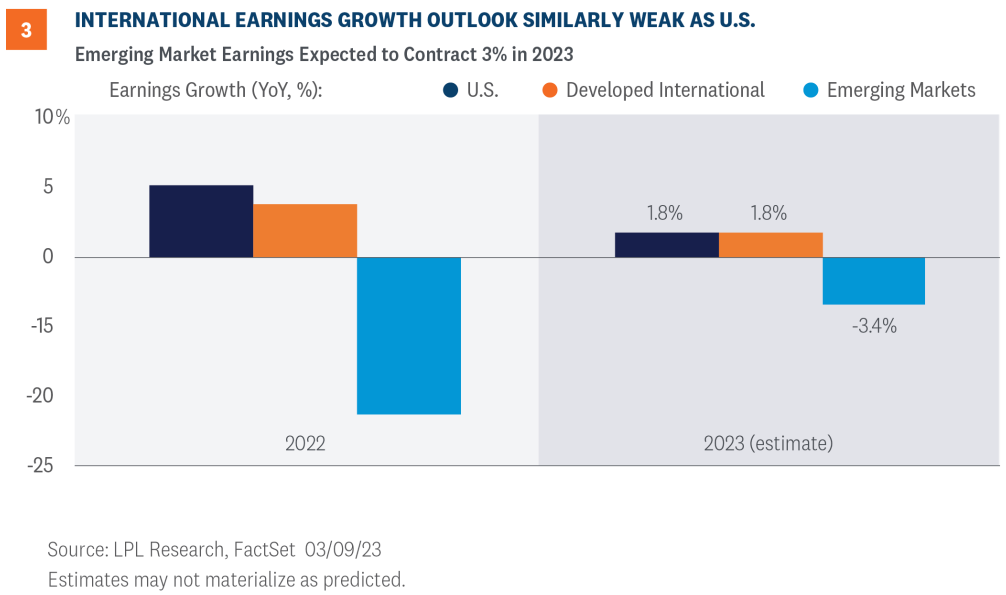
The earnings growth picture suggests a similar outlook for developed international and U.S. equities, as shown in Figure 3. These are just estimates, but consensus currently reflects 1.8% growth in earnings for the S&P 500 and MSCI EAFE indexes. The outlier is emerging markets (EM)—the MSCI EM Index is expected to see a 3.4% decline in earnings in 2023.
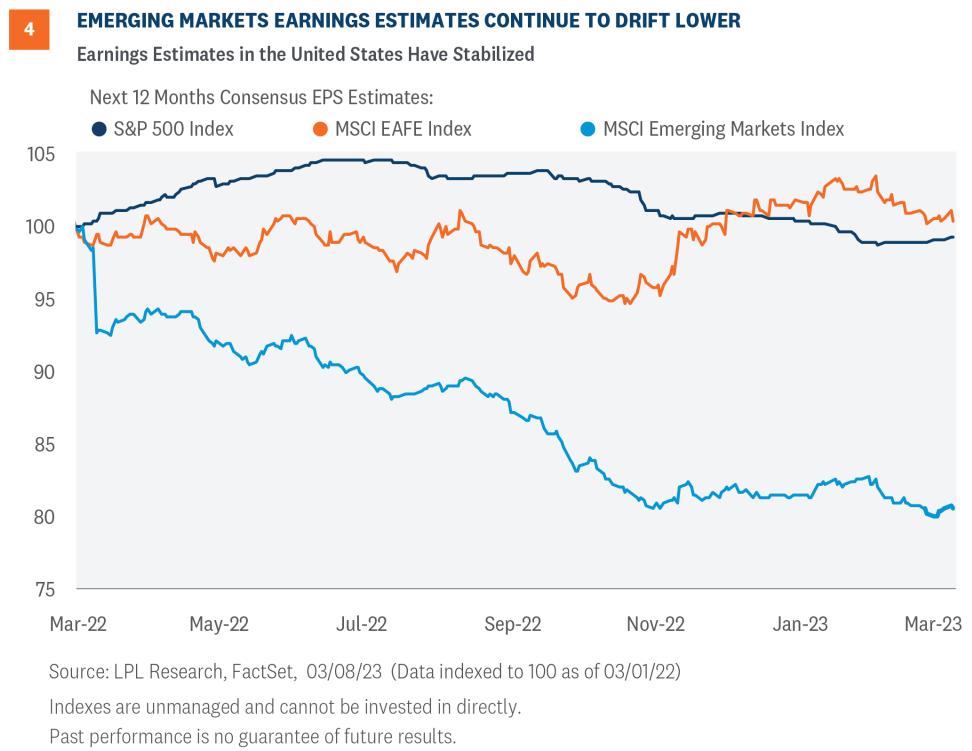
Not only is EM expected to see earnings fall this year, the momentum in those estimates is clearly negative (Figure 4). The U.S. earnings estimate trend is starting to inch higher, recent strength in international estimates has begun to roll over, and EM estimates have drifted lower over most of the past year. These earnings trends generally match our views on these three regions. Ongoing U.S.-China tensions and regulatory uncertainty add to our EM concerns.
From a technical perspective, international developed continues to outperform U.S. equity markets. The MSCI EAFE Index vs S&P 500 ratio chart has been climbing higher since October, with no signs of a trend change on the horizon. Emerging markets are beginning to look more constructive on a technical basis; however, there is insufficient technical evidence to make the call for a trend change at this time. Based on this backdrop, we prefer international developed markets over emerging markets. The STAAC’s next move is more likely to be upping developed international equities rather than emerging markets.
Conclusion
In conclusion, LPL Research maintains a slight preference for equities over fixed income, value over growth, small caps over large caps, and U.S. and developed international over emerging markets. The STAAC continues to watch for more clarity as to how long the inflation problem will persist, how far the Fed will have to go to tame it, and whether the U.S. economy can prove its skeptics wrong, muddle through, and avoid a recession. The failure of Silicon Valley Bank doesn’t make the road ahead for the economy any easier, but it may offer a silver lining for markets by slowing the Fed down.
IMPORTANT DISCLOSURES
This material is for general information only and is not intended to provide specific advice or recommendations for any individual. There is no assurance that the views or strategies discussed are suitable for all investors or will yield positive outcomes. Investing involves risks including possible loss of principal. Any economic forecasts set forth may not develop as predicted and are subject to change.
References to markets, asset classes, and sectors are generally regarding the corresponding market index. Indexes are unmanaged statistical composites and cannot be invested into directly. Index performance is not indicative of the performance of any investment and do not reflect fees, expenses, or sales charges. All performance referenced is historical and is no guarantee of future results.
Any company names noted herein are for educational purposes only and not an indication of trading intent or a solicitation of their products or services. LPL Financial doesn’t provide research on individual equities.
All information is believed to be from reliable sources; however, LPL Financial makes no representation as to its completeness or accuracy.
All investing involves risk, including possible loss of principal.
U.S. Treasuries may be considered “safe haven” investments but do carry some degree of risk including interest rate, credit, and market risk. Bonds are subject to market and interest rate risk if sold prior to maturity. Bond values will decline as interest rates rise and bonds are subject to availability and change in price.
The Standard & Poor’s 500 Index (S&P500) is a capitalization-weighted index of 500 stocks designed to measure performance of the broad domestic economy through changes in the aggregate market value of 500 stocks representing all major industries.
The PE ratio (price-to-earnings ratio) is a measure of the price paid for a share relative to the annual net income or profit earned by the firm per share. It is a financial ratio used for valuation: a higher PE ratio means that investors are paying more for each unit of net income, so the stock is more expensive compared to one with lower PE ratio.
Earnings per share (EPS) is the portion of a company’s profit allocated to each outstanding share of common stock. EPS serves as an indicator of a company’s profitability. Earnings per share is generally considered to be the single most important variable in determining a share’s price. It is also a major component used to calculate the price-to-earnings valuation ratio.
All index data from FactSet.
This research material has been prepared by LPL Financial LLC.
Securities and advisory services offered through LPL Financial (LPL), a registered investment advisor and broker-dealer (member FINRA/SIPC). Insurance products are offered through LPL or its licensed affiliates. To the extent you are receiving investment advice from a separately registered independent investment advisor that is not an LPL affiliate, please note LPL makes no representation with respect to such entity.
Not Insured by FDIC/NCUA or Any Other Government Agency | Not Bank/Credit Union Guaranteed | Not Bank/Credit Union Deposits or Obligations | May Lose Value
RES-1462000-0323 | For Public Use | Tracking # 1-05363610 (Exp. 03/24)