As the economy is likely downshifting, investors should take heed that the Federal Reserve’s (Fed) current stance is eerily similar to early 2007. During that time, the Fed held a tightening bias since they believed the housing market was stabilizing, the economy would continue to expand, and inflation risks remained. Clearly, their expectations were not met as the economy soon fell into recession. That’s not suggesting another 2008 is coming, but rather highlights how fast the economic environment can change.
Forecasting regime shifts are difficult for both public policymakers and private investors. The macro environment will likely experience a shift in the coming months as consumers retrench and businesses slow hiring. Despite emerging signs of slowing, the Fed recently communicated a hawkish stance on the path of interest rates going forward and the markets seemed to take it all in stride.
At the conclusion of the June 13-14 meeting, the Federal Open Market Committee (FOMC) kept rates unchanged but communicated a hawkish bias toward future interest rate decisions. Committee members were intent on further tightening but expressed concerns over unknown risks yet to emerge from the cumulative tightening over the past year. During the post-meeting press conference, Fed Chairman Jerome Powell indicated the Committee has not made a decision about next month, but if economic conditions hold steady, investors should pencil in a 0.25% increase to the fed funds rate.
Along with the statement, the Committee updated the Summary of Economic Projections (SEP), which is arguably more important than the brief monetary policy statement. Within the most recent SEP, most policymakers believe further tightening is needed unless conditions materially weaken.
Inflation is Going in the Right Direction
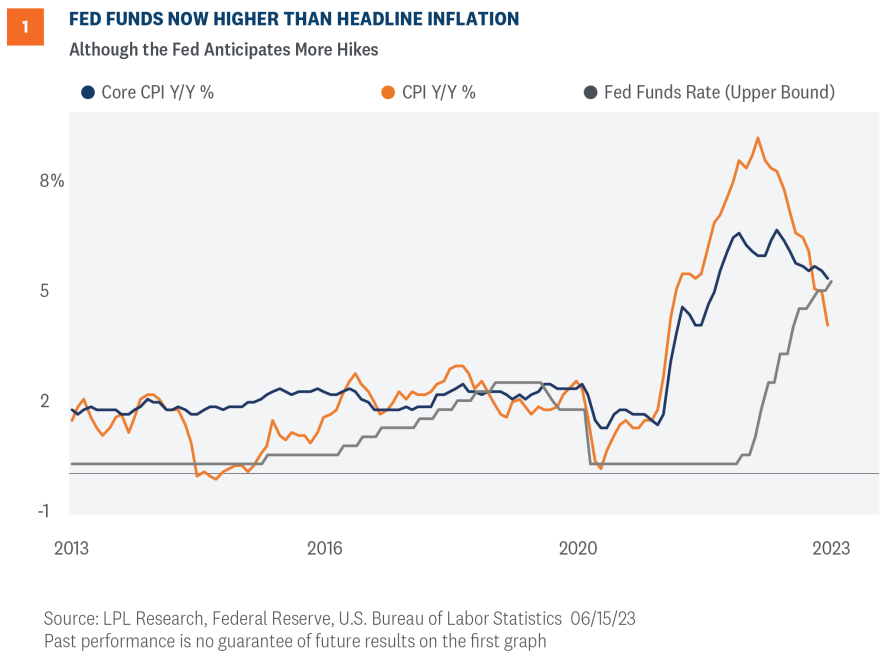
We think the Fed should consider the improving inflation outlook in addition to the other variables and concerns they’ve already stated. The latest Consumer Price Index (CPI) print decelerated toward the lower end of expectations, with overall headline inflation falling to the lowest level since April 2021. The encouraging trend in consumer prices will provide the Fed some leeway throughout the balance of 2023. Investors seem to believe the latest CPI report shows inflation is heading in the right direction and likely reinforced the Fed’s decision to skip a June rate hike or even pause for a longer period. As shown in Figure 1, headline inflation is below the fed funds upper bound, although core inflation is not decelerating as fast as headline inflation.
And perhaps that’s why equity markets added to recent gains over recent trading days, despite the disappointment that no Fed official thought conditions would warrant an outright cut in rates.

Fed Should Anticipate Further Easing in Rents
The housing sector is currently a significant factor impacting inflation in 2023. Shelter costs, which hold a significant weight in the CPI, are expected to ease. There is evidence rent costs will eventually decrease, as can be seen in the robust multi-family construction activity. As more projects hit the market this year due to the increase in condo and apartment units under construction, the supply of multi-family housing will rise, which should help bring down rent prices. As such, we don’t think it will be long before official government numbers reflect the decrease in rent prices. In the upcoming months, investors and policymakers alike should anticipate a slowing of housing-related inflation.
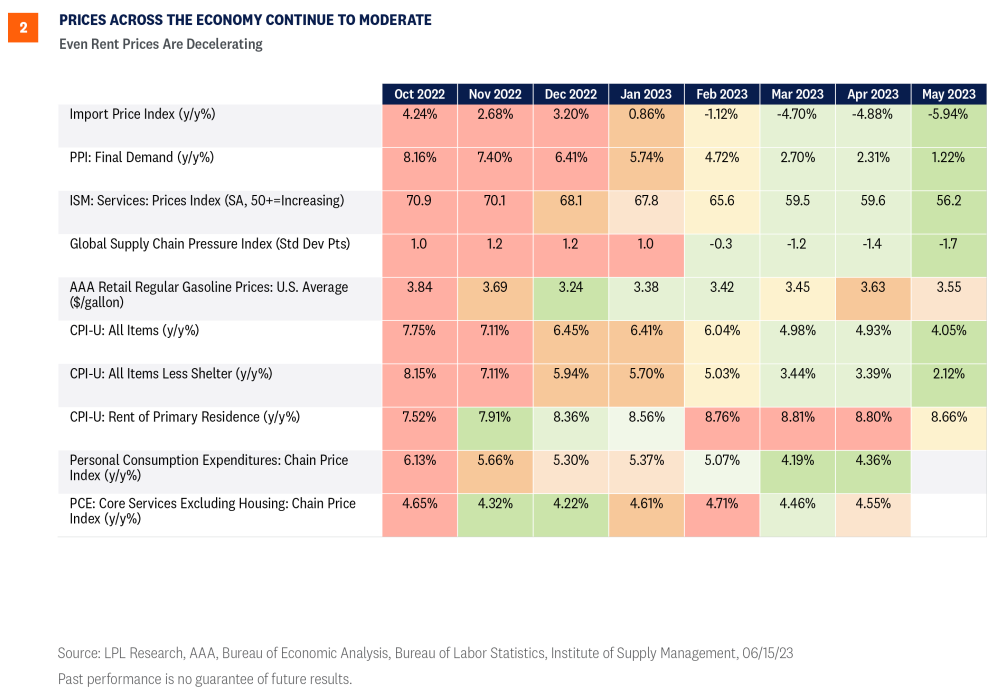
We have updated our Inflation Dashboard (Figure 2), designed to provide a snapshot of the inflationary environment, with the latest CPI data. The CPI rent of primary residence is the only one of our dashboard indicators that remains at an elevated level, and even that has fallen from an extreme level since April.

A Lot Can Change in a Few Quarters
So, why bring up a Fed statement from 2007? Because it’s a good example of how radically the economy can change in just a few quarters. In the January 2007 statement, the Fed communicated a “hawkish pause” because they anticipated a stabilizing housing market, a growing economy, and nagging inflation risks. A lot changed over the course of 2007 and 2008 as the economy fell into the Great Financial Crisis.
The current SEP revised up GDP growth forecasts and softened the deterioration in unemployment, and it seems the Fed is reticent to forecast a recession. However, our most likely scenarios put the economy in a mild recession by the end of the year as consumers retrench and businesses slow hiring as surveys suggest.
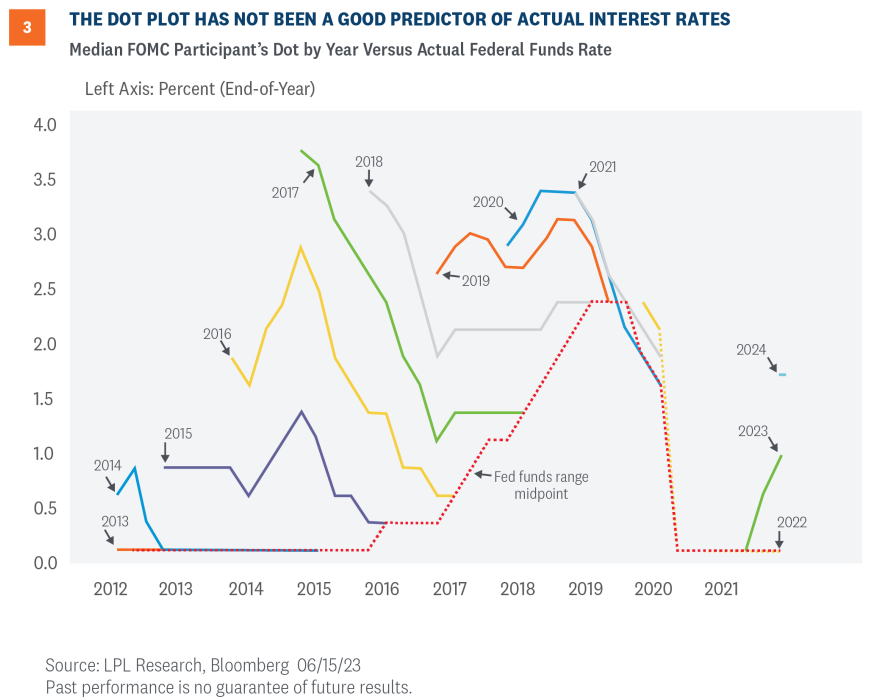
The release of the dot plot, which is the individual Committee member’s expectation of the appropriate fed funds rate each year, was the hawkish surprise markets were worried about. Despite raising rates by 5% over the past 15 months, the majority of the Committee, not just the median policymaker, sees at least two more 0.25% rate hikes this year, which would take the fed funds rate to 5.625%—the highest level since 2001. Moreover, the Committee thinks the fed funds rate should end 2024 at 4.625%, which reflects the potential for some rate cuts, but not as many as markets are expecting, which could put upward pressure on bond yields if those forecasts are accurate.
The Fed’s crystal ball is no better than the market’s and we know from history that the dot plot is not a good forecasting tool. As seen in Figure 3, the median forecast rarely, if ever, coordinated with actual policy rates (dashed red line). Dot plot medians tended to overestimate policy rates—sometimes by a wide margin. The most egregious example appears to be in 2015 (green line) when the Committee expected interest rates in 2017 to be above 3.5%, when in actuality they were closer to 0.50% that year. Nonetheless, it is worth watching how these views evolve in the coming months, which means either the Fed lowers its forecasts or the market adjusts higher, putting upward pressure on bond yields.

Summary and Investment Outlook
Periods of economic regime shifts are difficult for policymakers to manage. This current environment could be eerily similar to early 2007, when the Fed held a tightening bias on rates as they believed the housing market was stabilizing, the economy would continue to expand, and inflation risks remained. Both the January 2007 statement and the most recent one last week specifically mention the FOMC’s process in determining the extent of additional policy firming that may be needed. Clearly, those expectations were not met since we know what happened in later quarters. Despite the reference to 2007, our baseline is the economic slowdown does not produce another “2008,” yet investors should anticipate some volatility as the economic outlook remains cloudy.
With the Fed seemingly pushing out rate cuts, markets are probably going to be volatile over the next few quarters or at least until the inflationary story becomes clearer. LPL’s Strategic and Tactical Asset Allocation Committee (STAAC) recommends a neutral tactical allocation to equities, with a modest overweight to fixed income funded from cash. The risk-reward trade-off between stocks and bonds looks relatively even to us (as we wrote about here recently), with core bonds providing a yield advantage over cash. Moreover, as we wrote in our May 22 Weekly Market Commentary, despite the continued uncertainty around timing, a Fed pause has historically been a positive for core bond investors.
The STAAC recommends being neutral on style, favors developed international equities over emerging markets and large caps over small, and maintains the industrials sector as the top overall sector pick, with communication services and technology as top ideas based on technical analysis.
Within fixed income, the STAAC recommends an up-in-quality approach with a benchmark weight to duration. We think core bond sectors (U.S. Treasuries, agency mortgage-backed securities (MBS), and short-maturity investment grade corporates) are currently more attractive than plus sectors (high-yield bonds and non-U.S. sectors) with the exception of preferred securities, which look attractive after having recently sold off due to the banking stresses.
IMPORTANT DISCLOSURES
This material is for general information only and is not intended to provide specific advice or recommendations for any individual. There is no assurance that the views or strategies discussed are suitable for all investors or will yield positive outcomes. Investing involves risks including possible loss of principal. Any economic forecasts set forth may not develop as predicted and are subject to change.
References to markets, asset classes, and sectors are generally regarding the corresponding market index. Indexes are unmanaged statistical composites and cannot be invested into directly. Index performance is not indicative of the performance of any investment and do not reflect fees, expenses, or sales charges. All performance referenced is historical and is no guarantee of future results.
Any company names noted herein are for educational purposes only and not an indication of trading intent or a solicitation of their products or services. LPL Financial doesn’t provide research on individual equities.
All information is believed to be from reliable sources; however, LPL Financial makes no representation as to its completeness or accuracy.
US Treasuries may be considered “safe haven” investments but do carry some degree of risk including interest rate, credit, and market risk. Bonds are subject to market and interest rate risk if sold prior to maturity. Bond values will decline as interest rates rise and bonds are subject to availability and change in price.
The Standard & Poor’s 500 Index (S&P500) is a capitalization-weighted index of 500 stocks designed to measure performance of the broad domestic economy through changes in the aggregate market value of 500 stocks representing all major industries.
The PE ratio (price-to-earnings ratio) is a measure of the price paid for a share relative to the annual net income or profit earned by the firm per share. It is a financial ratio used for valuation: a higher PE ratio means that investors are paying more for each unit of net income, so the stock is more expensive compared to one with lower PE ratio.
Earnings per share (EPS) is the portion of a company’s profit allocated to each outstanding share of common stock. EPS serves as an indicator of a company’s profitability. Earnings per share is generally considered to be the single most important variable in determining a share’s price. It is also a major component used to calculate the price-to-earnings valuation ratio.
All index data from FactSet.
There is no guarantee that a diversified portfolio will enhance overall returns or outperform a non-diversified portfolio. Diversification does not protect against market risk.
Asset allocation does not ensure a profit or protect against a loss.
A CDS contract is a derivative product that protects the CDS buyer from a credit default of the underlying security. Credit risk is transferred to the seller of the CDS contract, who requires a premium for the protection. As credit risk increases or decreases, the contract premium goes up and down, similar to an insurance policy.
A typical notional on a CDS is in the range $10-$20 mm. CDSs have a stated maturity (typical terms are 3, 5, 7, and 10 years), with the most liquid point at 5 years. Typically, credit default swaps are the domain of institutional investors.
Preferred stock dividends are paid at the discretion of the issuing company. Preferred stocks are subject to interest rate and credit risk. As interest rates rise, the price of the preferred falls (and vice versa). They may be subject to a call feature with changing interest rates or credit ratings.
The fast price swings in commodities will result in significant volatility in an investor’s holdings. Commodities include increased risks, such as political, economic, and currency instability, and may not be suitable for all investors.
Value investments can perform differently from the market as a whole. They can remain undervalued by the market for long periods of time.
The prices of small cap stocks are generally more volatile than large cap stocks.
International investing involves special risks such as currency fluctuation and political instability and may not be suitable for all investors. These risks are often heightened for investments in emerging markets.
This research material has been prepared by LPL Financial LLC.
Securities and advisory services offered through LPL Financial (LPL), a registered investment advisor and broker-dealer (member FINRA/SIPC). Insurance products are offered through LPL or its licensed affiliates. To the extent you are receiving investment advice from a separately registered independent investment advisor that is not an LPL affiliate, please note LPL makes no representation with respect to such entity.
Not Insured by FDIC/NCUA or Any Other Government Agency | Not Bank/Credit Union Guaranteed | Not Bank/Credit Union Deposits or Obligations | May Lose Value
RES-1547550-0523 | For Public Use | Tracking # 1-05373578 (Exp. 06/2024)
For a list of descriptions of the indexes referenced in this publication, please visit our website at lplresearch.com/definitions.