We know it’s old news at this point, but on June 8, 2023, the S&P 500 entered a new bull market. After such a strong rally off the October lows, this young bull probably needs a breather. A look at the charts suggests this market may be due for a pause. Bull markets are not linear. However, the impending end of the Federal Reserve (Fed) rate-hiking campaign, and the economy’s and corporate America’s resilience, help make the bull case that steers LPL Research toward a neutral, rather than negative, equities view from a tactical asset allocation perspective.
New Bull Market Has Arrived
The S&P 500 has climbed into bull market territory after rallying more than 20% off the October 2022 lows, establishing October 12, 2022, as the bear market low. It took 165 trading days for the S&P 500 to surpass the 20% threshold off that bear market low, marking the second longest period to confirm a new bull market in nearly 75 years.
While the 20% qualifier meets the technical definition of a bull market, there is additional evidence supporting the transition from a bear to bull market. First, demand for equities continues to rise, forming a series of higher highs and higher lows since October. This uptrend has further been validated by the S&P 500 Index crossing back above its longer-term 200-day moving average (dma).
Second, while leadership remains narrow, participation in this year’s rally has been cyclical. Communication services, consumer discretionary, industrials, and technology enjoy the best sector breadth and the highest percentage of stocks outperforming the market this year. Meanwhile, defensive sectors, such as consumer staples and utilities, continue to underperform with relatively weak sector breadth.
Lastly, bull markets are not linear, and with the S&P 500 well extended above its uptrend, we suspect a pullback or pause is likely. The S&P 500’s Relative Strength Index (RSI)—a momentum oscillator used to measure the speed and magnitude of price action—recently reached its most overbought reading since November 2021 (Figure 1).
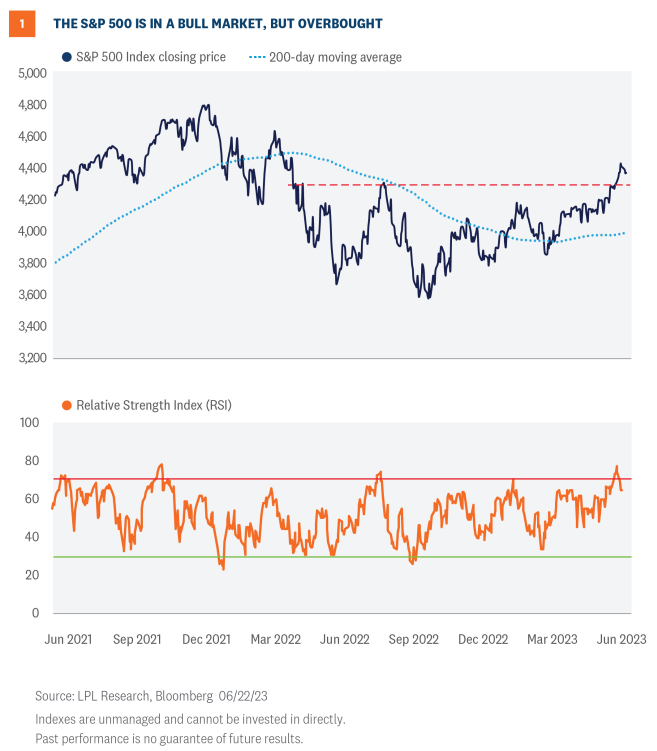
However, the good news with a bull market is that mean reversion from overbought levels is typically resolved near the market’s longer-term uptrend. For the S&P 500, that technically means investors could see pullback opportunities toward the rising 200-dma (3,991) over the coming months.
Following The Playbook
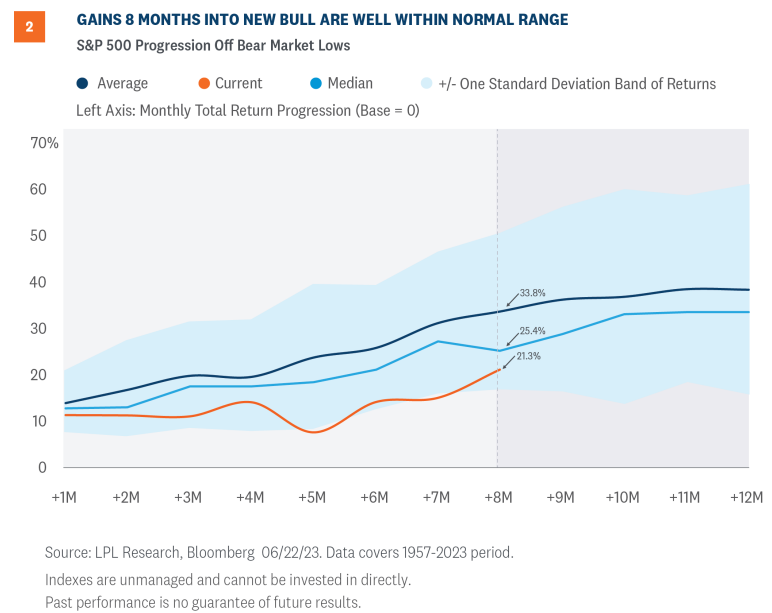
This rally seems quite powerful based on the eight month move, but it’s really quite ordinary for an early-stage bull market. In fact, the average price gain for an eight-month-old bull market for the S&P 500 is 33.8%, based on nearly 70 years of history (Figure 2). The median performance, at 25.4%, is a better representation of where stocks might normally be at this stage because it takes out the ferocious V-shaped rebounds coming out of the 2008-2009 Great Financial Crisis and the early stages of the pandemic in March 2020. With a roughly 21% price gain so far for this young bull, S&P 500 performance is well within the normal historical range.
Where We Might Go From Here
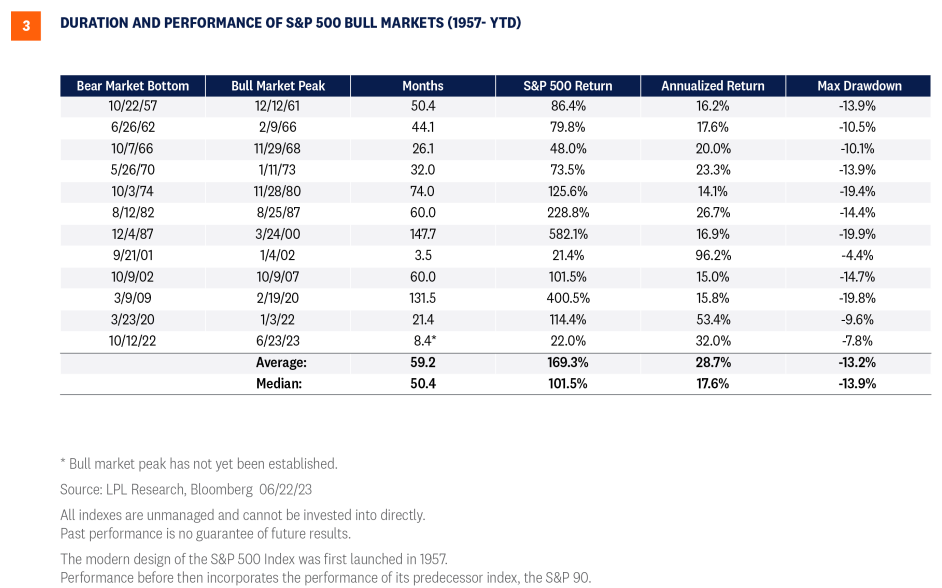
Of course, we don’t know when the next bear market will arrive, but based on history, there is a good chance it doesn’t show up for quite a while. The duration of a bull market can vary significantly, but historically they have been long-lasting. Since 1957, the average S&P 500 bull market has lasted 59.2 months and produced an average cumulative gain of 169.3% (Figure 3). However, bull markets are not linear and have experienced average maximum drawdowns of 13.2%, similar to the average maximum S&P 500 drawdown in any year of 14.3%.
Investment Outlook
Stocks have had a strong rally over the past eight months to establish a new bull market. With the broad market overbought in the short-term from a technical analysis perspective and valuations elevated, stocks may be due for a pause. At the same time, the resilience of the U.S. economy and corporate America has been impressive. Our base case calls for a mild and short-lived recession to begin by year-end, but the latest economic data have slightly raised the odds of a soft landing. Moreover, a Fed pause is likely coming soon, if it’s not already here, supporting the bull case for equities and a neutral, rather than negative view.
LPL’s Strategic and Tactical Asset Allocation Committee (STAAC) recommends a neutral tactical allocation to equities, with a modest overweight to fixed income funded from cash. The risk-reward trade-off between stocks and bonds looks relatively even to us (as we wrote about here recently), with core bonds providing a yield advantage over cash. Also consider a Fed pause has historically been a positive for core bond investors, though the exact timing for that remains uncertain.
The STAAC recommends being neutral on style, favors developed international equities over emerging markets and large caps over small, and maintains the industrials sector as the top overall sector pick, with communication services and technology as top ideas based on technical analysis.
Within fixed income, the STAAC recommends an up-in-quality approach with a benchmark weight to duration. We think core bond sectors (U.S. Treasuries, agency mortgage-backed securities (MBS), and short-maturity investment grade corporates) are currently more attractive than plus sectors (high-yield bonds and non-U.S. sectors) with the exception of preferred securities, which look attractive after having sold off due to stresses in the banking system.
IMPORTANT DISCLOSURES
This material is for general information only and is not intended to provide specific advice or recommendations for any individual. There is no assurance that the views or strategies discussed are suitable for all investors or will yield positive outcomes. Investing involves risks including possible loss of principal. Any economic forecasts set forth may not develop as predicted and are subject to change.
References to markets, asset classes, and sectors are generally regarding the corresponding market index. Indexes are unmanaged statistical composites and cannot be invested into directly. Index performance is not indicative of the performance of any investment and do not reflect fees, expenses, or sales charges. All performance referenced is historical and is no guarantee of future results.
Any company names noted herein are for educational purposes only and not an indication of trading intent or a solicitation of their products or services. LPL Financial doesn’t provide research on individual equities.
All information is believed to be from reliable sources; however, LPL Financial makes no representation as to its completeness or accuracy.
US Treasuries may be considered “safe haven” investments but do carry some degree of risk including interest rate, credit, and market risk. Bonds are subject to market and interest rate risk if sold prior to maturity. Bond values will decline as interest rates rise and bonds are subject to availability and change in price.
The Standard & Poor’s 500 Index (S&P500) is a capitalization-weighted index of 500 stocks designed to measure performance of the broad domestic economy through changes in the aggregate market value of 500 stocks representing all major industries.
The PE ratio (price-to-earnings ratio) is a measure of the price paid for a share relative to the annual net income or profit earned by the firm per share. It is a financial ratio used for valuation: a higher PE ratio means that investors are paying more for each unit of net income, so the stock is more expensive compared to one with lower PE ratio.
Earnings per share (EPS) is the portion of a company’s profit allocated to each outstanding share of common stock. EPS serves as an indicator of a company’s profitability. Earnings per share is generally considered to be the single most important variable in determining a share’s price. It is also a major component used to calculate the price-to-earnings valuation ratio.
All index data from FactSet.
There is no guarantee that a diversified portfolio will enhance overall returns or outperform a non-diversified portfolio. Diversification does not protect against market risk.
Asset allocation does not ensure a profit or protect against a loss.
A CDS contract is a derivative product that protects the CDS buyer from a credit default of the underlying security. Credit risk is transferred to the seller of the CDS contract, who requires a premium for the protection. As credit risk increases or decreases, the contract premium goes up and down, similar to an insurance policy.
A typical notional on a CDS is in the range $10-$20 mm. CDSs have a stated maturity (typical terms are 3, 5, 7, and 10 years), with the most liquid point at 5 years. Typically, credit default swaps are the domain of institutional investors.
Preferred stock dividends are paid at the discretion of the issuing company. Preferred stocks are subject to interest rate and credit risk. As interest rates rise, the price of the preferred falls (and vice versa). They may be subject to a call feature with changing interest rates or credit ratings.
The fast price swings in commodities will result in significant volatility in an investor’s holdings. Commodities include increased risks, such as political, economic, and currency instability, and may not be suitable for all investors.
Value investments can perform differently from the market as a whole. They can remain undervalued by the market for long periods of time.
The prices of small cap stocks are generally more volatile than large cap stocks.
International investing involves special risks such as currency fluctuation and political instability and may not be suitable for all investors. These risks are often heightened for investments in emerging markets.
This research material has been prepared by LPL Financial LLC.
Securities and advisory services offered through LPL Financial (LPL), a registered investment advisor and broker-dealer (member FINRA/SIPC). Insurance products are offered through LPL or its licensed affiliates. To the extent you are receiving investment advice from a separately registered independent investment advisor that is not an LPL affiliate, please note LPL makes no representation with respect to such entity.
Not Insured by FDIC/NCUA or Any Other Government Agency | Not Bank/Credit Union Guaranteed | Not Bank/Credit Union Deposits or Obligations | May Lose Value
RES-1547550-0523 | For Public Use | Tracking # 1-05374007 (Exp. 06/2024)