The long dormant capital markets have recently begun showing signs of interest from institutional investors and deal makers anxious to bring companies to market. While activity remains muted at best, expectations are focused on 2024, when there is a prevailing consensus that the Federal Reserve (Fed) will be finished with its rate hike campaign, and that economic conditions will be resilient enough to underpin a strong capital markets environment. Given the country’s unique characteristics in nurturing innovation and technological leadership, the role of capital markets is crucial in maintaining hegemony. That Apple’s market capitalization at the close of the second quarter crossed over $3 trillion, exemplifies the country’s dominance and the role of innovative experimentation.
Capital Markets – The Essence of American Capitalism
It invariably starts with a spark, or a fully developed idea that challenges the existing way of doing things, of accomplishing tasks and goals, and of broadening our collective perspective. But just as assuredly, it is typically based and built upon an existing platform, whether it’s a technological infrastructure or a singular methodology. The goal is to improve, to expand and enhance the experience.
Within recent U.S. history, the mega-cap technology names that have dominated markets all began with a creative idea, whether in a college dorm room or in a garage. In the fast food space, a singular hot dog stand led to the creation of a well-known chain within the fast-casual restaurant space. The early and successful budget airlines, or online digitized and aggregated commercial real estate data, all emanated from strong conviction.
And so it goes within all sectors. An idea that is developed and nurtured by entrepreneurs within a unique American culture that cultivates the idiosyncratic brilliance of each innovator.
Later on, funding becomes essential, either via private equity, venture capital, or a direct relationship with investment banks, and even the Bank of Mom and Dad. This ultimately leads to, and represents, the very fabric and infrastructure of capital markets, which generally encompasses initial public offerings (IPOs), secondary offerings, and mergers and acquisitions (M&A).
The Current Environment
Amid a broader backdrop of rate hike comments from central bankers and associated recession concerns, there are near-daily headlines noting investment banking layoffs as firms continue to trim costs.
However, there has been a recent spate of comments mentioning the appearance of “green shoots,” as dealmakers and lawyers note that with the debt ceiling negotiations completed, and the regional bank crisis appearing to have abated, much of the uncertainty hovering over markets has eased.
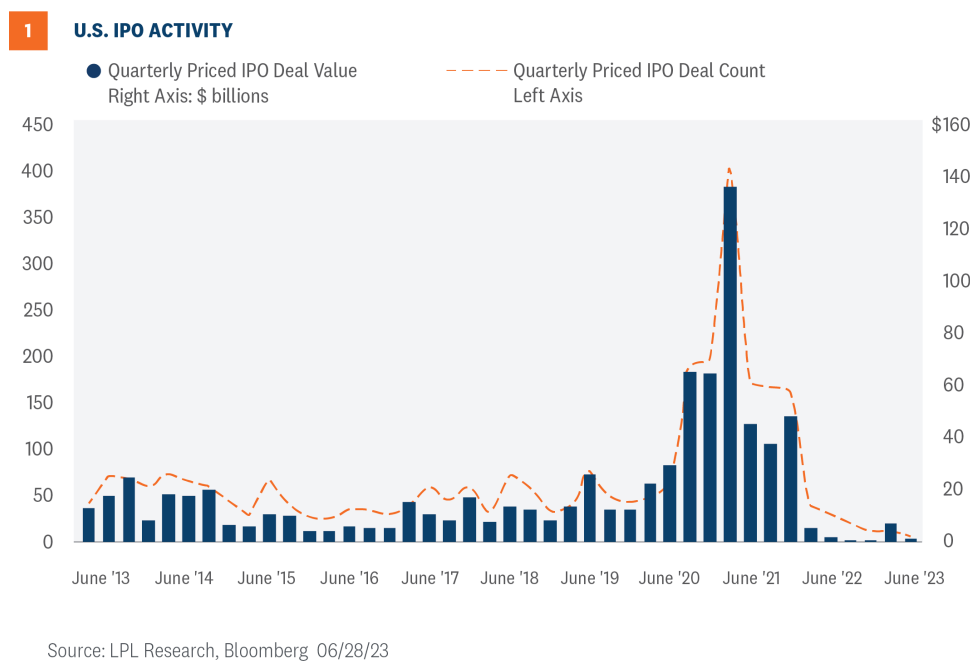
Initial Public Offerings (IPOs) Beginning to Surface
Following nearly 18 months of being virtually dormant (Figure 1), IPOs are beginning to emerge with successful results. With economic data continuing to suggest the U.S. economy remains on solid footing, and expectations the Fed is close to completing its rate hiking campaign, bankers are hopeful they can begin taking a growing pipeline of companies public.
With the S&P 500 within bull market territory, coupled with the VIX Index (volatility index) relatively subdued, bankers have begun taking advantage of a window of opportunity for offerings.
The widely followed Goldman Sachs IPO Issuance Barometer recently climbed to levels that suggest a positive macroeconomic underpinning for IPOs. While the amount raised so far is relatively small—$10.6 billion through mid-June—bankers see the second half of 2023 and 2024 poised for considerable improvement.
The president of the New York Stock Exchange (NYSE) recently said her phone “is already ringing,” and there are many “green shoots.”
With the recent success of the Cava Group Inc. (CAVA) IPO debut on June 15, a handful of companies are now hoping to follow suit and are preparing to go public within the next few months, as long as economic and financial conditions remain supportive.
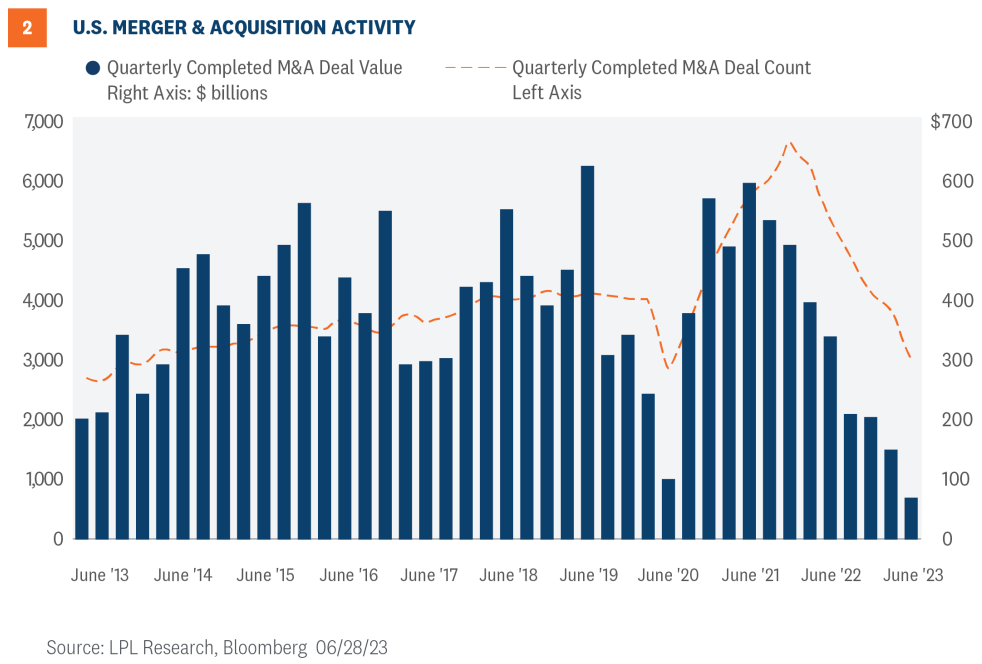
Mergers and Acquisitions Showing Signs of Interest
Similarly, merger and acquisition (M&A) activity has been hesitant as global central bankers continue to stress they will continue raising rates to quell inflation; however, as with the IPO market, deal flow has begun to pick up (Figure 2). Globally, approximately $1.22 trillion worth of deals have been executed year to date. Last year, deals for the first half of the year were valued at $2 trillion.
This year, cross border activity has focused on the pharmaceutical sector as well as metals and mining.
Specifically for the U.S., M&A deal making volumes for the first half of this year totaled $318.4 billion in commercial activity, 30% below the same period last year.
However, if the U.S. averts a hard landing, which is now the prevailing consensus, expectations are for a significant increase in broad capital market deal making.
As American as Apple Pie at $3 Trillion
The classic American entrepreneurial story began on April 1, 1976, shortly after a severe recession ended in 1975. And it was set in the Jobs’ family garage where Steve Jobs and Steve Wozniak built the Apple I microcomputer. Later, on December 12, 1980, Apple went public at $22 per share, and has undergone five stock splits since then.
Today, at the end of the first half of 2023, Apple crossed $3 trillion in market capitalization, making it the largest company globally. Apple was the first publicly traded company in the U.S. to reach a $1 trillion market cap in intraday trading on August 2, 2018.
Through continued innovation, Apple has been ubiquitous in our daily corporate and personal lives as it has also relied on the strength of the country’s capital markets to underpin its growth.
Whether it’s originated in garages, dorm rooms, or a parent’s basement, the distinct qualities of the country’s entrepreneurial spirit perseveres across sectors and are fostered by the essence of American capitalism—our capital markets.
Investment Conclusion
Stocks have celebrated the newly minted bull market, closing out one of the best first halves for the S&P 500 in recent decades, up 15.9%, and a third consecutive quarterly gain over 7%. While this latest rally may have outpaced fundamentals in the short term, from a technical analysis perspective, and valuations look full, at the same time, the resilience of the U.S. economy and corporate America have has been impressive. The latest economic data slightly raised the odds of a soft landing or muddle through economy, but our base case still calls for a mild and short-lived recession to begin by year-end. A Fed pause is likely coming soon, if it’s not already here, as inflation continues to ease, supporting the case for staying fully invested.
LPL’s Strategic and Tactical Asset Allocation Committee (STAAC) recommends a neutral tactical allocation to equities, with a modest overweight to fixed income funded from cash. The risk-reward trade-off between stocks and bonds looks relatively balanced to us, with core bonds providing a yield advantage over cash. Also consider a Fed pause has historically been a positive for core bond investors, though the exact timing for that remains uncertain.
The STAAC recommends being neutral on style, favors developed international equities over emerging markets and large caps over small, and maintains the industrials sector as the top overall sector pick.
Within fixed income, the STAAC recommends an up-in-quality approach with benchmark-level interest rate sensitivity. We think core bond sectors (U.S. Treasuries, agency mortgage-backed securities (MBS), and short-maturity investment grade corporates) are currently more attractive than plus sectors (high-yield bonds and non-U.S. sectors) with the exception of preferred securities, which look attractive after having sold off due to stresses in the banking system.
IMPORTANT DISCLOSURES
This material is for general information only and is not intended to provide specific advice or recommendations for any individual. There is no assurance that the views or strategies discussed are suitable for all investors or will yield positive outcomes. Investing involves risks including possible loss of principal. Any economic forecasts set forth may not develop as predicted and are subject to change.
References to markets, asset classes, and sectors are generally regarding the corresponding market index. Indexes are unmanaged statistical composites and cannot be invested into directly. Index performance is not indicative of the performance of any investment and do not reflect fees, expenses, or sales charges. All performance referenced is historical and is no guarantee of future results.
Any company names noted herein are for educational purposes only and not an indication of trading intent or a solicitation of their products or services. LPL Financial doesn’t provide research on individual equities.
All information is believed to be from reliable sources; however, LPL Financial makes no representation as to its completeness or accuracy.
US Treasuries may be considered “safe haven” investments but do carry some degree of risk including interest rate, credit, and market risk. Bonds are subject to market and interest rate risk if sold prior to maturity. Bond values will decline as interest rates rise and bonds are subject to availability and change in price.
The Standard & Poor’s 500 Index (S&P500) is a capitalization-weighted index of 500 stocks designed to measure performance of the broad domestic economy through changes in the aggregate market value of 500 stocks representing all major industries.
The PE ratio (price-to-earnings ratio) is a measure of the price paid for a share relative to the annual net income or profit earned by the firm per share. It is a financial ratio used for valuation: a higher PE ratio means that investors are paying more for each unit of net income, so the stock is more expensive compared to one with lower PE ratio.
Earnings per share (EPS) is the portion of a company’s profit allocated to each outstanding share of common stock. EPS serves as an indicator of a company’s profitability. Earnings per share is generally considered to be the single most important variable in determining a share’s price. It is also a major component used to calculate the price-to-earnings valuation ratio.
All index data from FactSet.
Value investments can perform differently from the market as a whole. They can remain undervalued by the market for long periods of time.
The prices of small cap stocks are generally more volatile than large cap stocks.
International investing involves special risks such as currency fluctuation and political instability and may not be suitable for all investors. These risks are often
heightened for investments in emerging markets.
LPL Financial does not provide investment banking services and does not engage in initial public offerings or merger and acquisition activities.
This research material has been prepared by LPL Financial LLC.
Securities and advisory services offered through LPL Financial (LPL), a registered investment advisor and broker-dealer (member FINRA/SIPC). Insurance products are offered through LPL or its licensed affiliates. To the extent you are receiving investment advice from a separately registered independent investment advisor that is not an LPL affiliate, please note LPL makes no representation with respect to such entity.
Not Insured by FDIC/NCUA or Any Other Government Agency | Not Bank/Credit Union Guaranteed | Not Bank/Credit Union Deposits or Obligations | May Lose Value
RES-1580014-0623 | For Public Use | Tracking # 1-05374413 (Exp. 07/2024)
For a list of descriptions of the indexes referenced in this publication, please visit our website at lplresearch.com/definitions.