It’s different this time. The four (or five) most dangerous words in investing. We’ll take the risk and use those words here as we break down the recent decision by credit rating agency Fitch to downgrade U.S. government debt to its second-highest rating, AA+ (note that several countries in Europe, including Denmark, Germany, Netherlands, and Switzerland enjoy AAA ratings, as do Johnson and Johnson (JNJ) and Microsoft (MSFT)). We compare the potential market impact of this decision to what markets experienced in 2011 when S&P issued its U.S. debt downgrade.
What Fitch Was Thinking
On August 1, one of the three main credit rating agencies, Fitch, downgraded U.S. government debt to its second-highest rating, AA+. The agency cited “the expected fiscal deterioration over the next three years, a high and growing general debt burden, and the erosion of governance relative to ‘AA’ and ‘AAA’ rated peers over the last two decades” as reasons for the downgrade. The move was not a surprise after the rating agency warned in June that a downgrade was an option even after the debt ceiling resolution and, frankly, had been warning of a downgrade for years.
The move stirred up memories of the last downgrade of the U.S. government’s credit rating from Standard & Poor’s (S&P) back in 2011 (note that rating agency Moody’s still has the U.S. at Aaa, while S&P remains at AA+. As shown in Figure 1, the stock market sold off sharply in August 2011 on the S&P move. In fact, with a 19%-plus peak-to-trough decline in the S&P 500 that summer through early fall, the long 2010s bull market from 2009 to 2020 almost came to an end prematurely based on closing prices—though some investors considered 2011 a separate bear market.
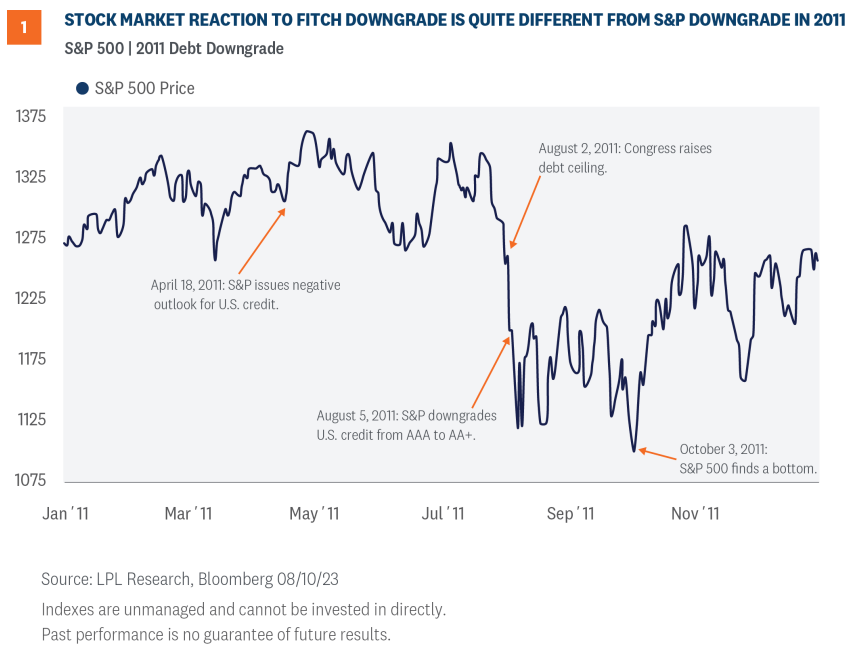
Understandably, some investors got nervous this time with the Fitch news that markets might repeat that 2011 descent. While it’s dangerous in this business to think it’s different this time, below we discuss why it is. Not only that, the market reaction has been much more subdued since the announcement—the S&P 500 fell about 2% during the three days following the news when many were calling for a pullback before the Fitch move.
Bond Market Makes More Noise
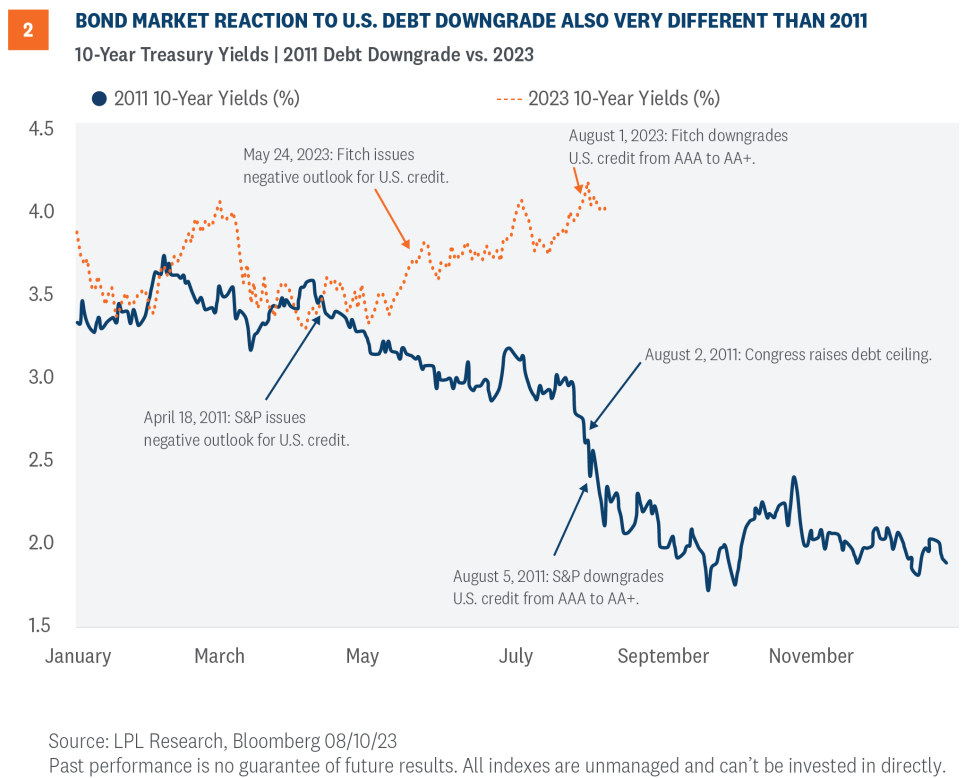
While the stock market’s reaction to the Fitch news was well contained, the bond market has made a bit more noise. As you can see in Figure 2, since Fitch issued a negative outlook for U.S. credit in May, the 10-year yield has steadily marched higher, from 3.74% to 4.15%. Some of that move was driven by the market assigning a higher probability of a soft landing for the U.S. economy as inflation has fallen and heavy issuance of U.S. Treasuries by the federal government. But the 15 basis point (bps) move in yields from August 1 through August 3 clearly points to the impact of the Fitch decision and increased attention that news brought to the challenging task of putting the U.S. fiscal house in order.
While not necessarily wrong in its assessment, the rating downgrade itself will likely not have any material, sustained impact on U.S. government debt or markets broadly. The U.S. remains the safe haven during times of market stress and the downgrade will likely not change that, despite the jump in yields following the news.
Why This Isn’t 2011
This all begs the question, what is different this time? One reason is we’ve been here before, which should limit any ripple effects in terms of further market reaction. S&P arguably carries more weight than Fitch and already made this move 12 years ago. Back then, S&P noted the downgrade “reflects our opinion that the … plan that Congress and the Administration recently agreed to falls short of what, in our view, would be necessary to stabilize the government’s medium-term debt dynamics.”
While that development came as an initial surprise to markets back then, stocks recovered in short order with the S&P 500 Index rebounding and finishing up the year more than 12% off those lows before gaining another 12% during the first quarter of 2012. While LPL Research believes stocks are due for a 5-10% pullback at some point between now and year-end, we do not think the market has to go through a sharp correction again that we experienced in 2011.
This time is also different because the European debt crisis was raging in 2011 when many thought the Eurozone might break apart, an event that could have been extremely disruptive to global markets (remember when the financial industry was so focused on Greece?). That risk is well behind us.
We’re also battling inflation in the U.S. now, which is pushing interest rates higher following the most aggressive Federal Reserve (Fed) rate hiking cycle in decades. In 2011, the Fed held its target interest rate at zero and was doing quantitative easing (buying bonds) in the aftermath of the Great Financial Crisis (GFC) of 2008-2009. The Fed’s balance sheet expanded in 2011, while it’s contracting this year. Investors’ psyche was also quite fragile coming out of that period as the GFC memories were still fresh, another big difference between then and now.
What The Future Might Hold
While Fitch’s opinion in and of itself doesn’t matter all that much in the grand scheme of things, one potential reason why it could matter to investors is likely only administrative. The U.S. is officially split-rated, so accounts that have minimum AAA-rating requirements may have to change account documentation, but it will not likely result in forced selling. That said, continued fiscal expansion/deficits could result in additional downgrades from rating agencies. So, until the U.S. government gets its fiscal house in order, we’re likely going to see additional downgrades.
The Fitch downgrade highlighted more than just the expanding deficit, with a targeted focus on the political backdrop, which it characterized as mired in paralyzing internecine politics. To be sure, the inability of both sides of the aisle to quell deficit spending has been a longstanding concern for Main Street, USA. The ramifications of allowing the debt to expand ultimately, unfortunately, include the need to raise taxes across the board and impair consumers’ discretionary income. Considering consumers are responsible for approximately 68% of the country’s GDP, higher taxes could certainly jeopardize economic growth in the future.
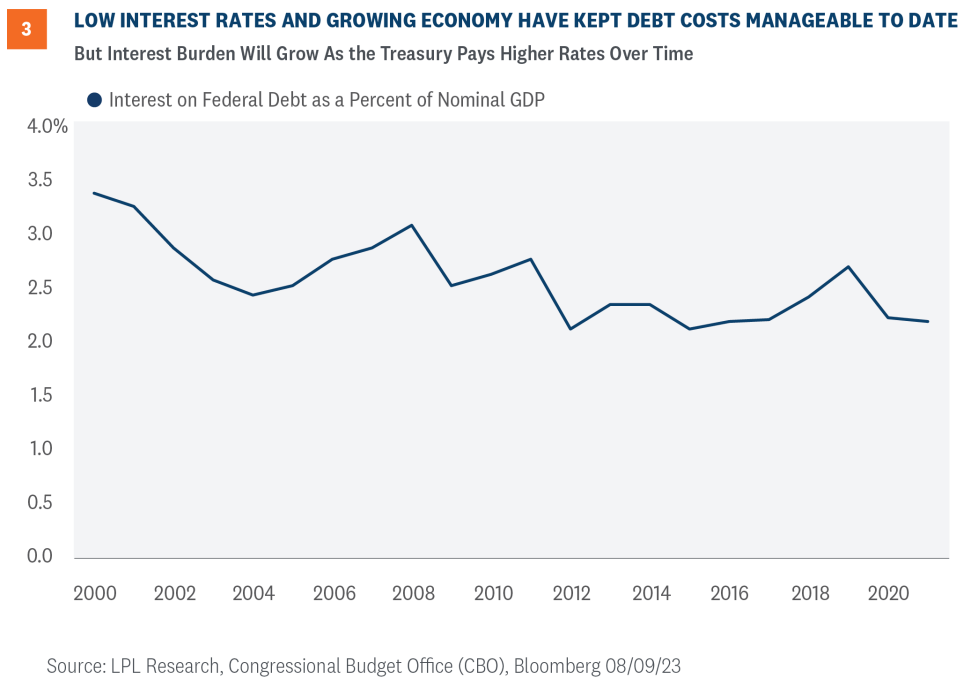
Another primary concern is the potential rise in interest rates that would be required to attract buyers, including foreign buyers, into the U.S. Treasury market to help service the country’s debt. The U.S. has been fortunate that low interest rates have keep interest costs manageable in recent years (Figure 3), but this luck may run out. Interest costs to the federal government were just 2.3% of nominal GDP in the latest quarter, below levels observed in recent decades. Note that Treasury Secretary Janet Yellen has referenced 3% as a dangerous number in the past.
Perhaps a better way to assess the situation is to compare net interest costs to tax revenue, as Dan Clifton, policy strategist at Strategas, has done. That figure is currently at 13% and rising, the highest level in more than 20 years, and comes at a time when the cost of debt for the U.S. government is still about half of what it was 20 years ago (3% vs. 6%). As the effective cost of U.S. debt rise —though hopefully slowly as government tax receipts grow alongside a growing economy and appreciating investments—the debt burden will become more painful. This means spending cuts are eventually coming, along with tax increases. The question is when and how much.
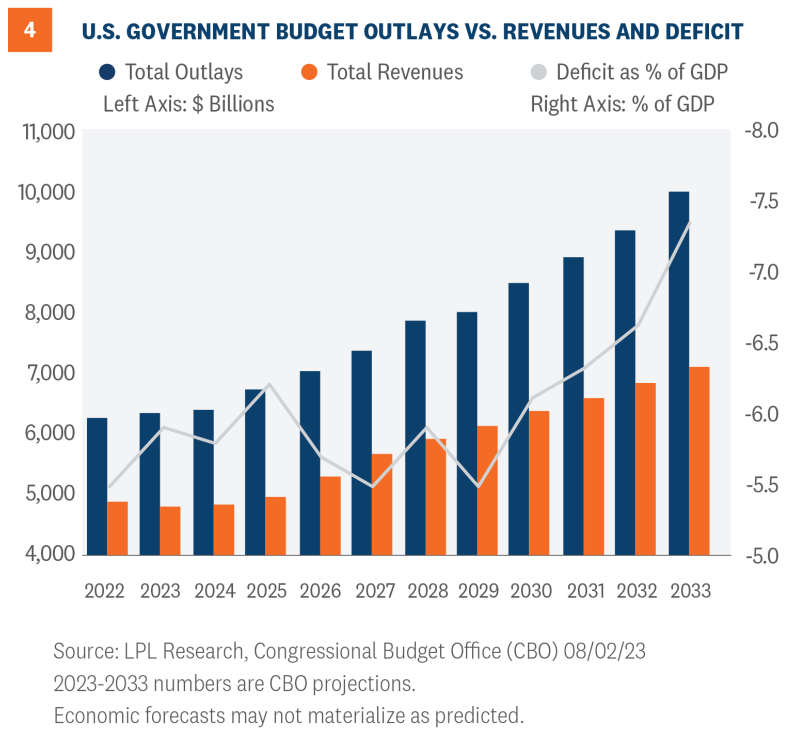
Allowing the deficit to expand at the current pace would bring into question the ability of the government to fund the benefit programs that the average citizen has paid into during their working years. Projections by the non-partisan Congressional Budget Office (CBO) for the next 10 years reveal just how dramatically the deficit could rise if the U.S. remains on its current path of, dare we say, fiscal profligacy (Figure 4). If tax revenues continue to trail government outlays, the deficit as a percent of GDP could jump another 2 points over the next 10 years at a time when the debt could be as expensive to service as its been in several decades.
Investment Conclusion
We all know the U.S. has a debt problem. We didn’t need Fitch to tell us that. But what Fitch did, and S&P before them, was shine a light on the need for us to contain spending to help get the U.S. on a more sustainable path. This problem doesn’t have to be fixed right now, but the longer we wait, the more difficult the problem becomes to manage.
In terms of investment implications, we may see the 10-year Treasury yield above what we deem as fair value in the near term despite cooling inflation, before eventually settling back down in the mid-to-high threes if our forecast is right. A Fed pause is increasingly likely in September, which should help send rates down and prop up core bond returns.
LPL Research continues to like high quality fixed income here despite upward pressure on rates recently. We think core bond sectors (U.S. Treasuries, agency mortgage-backed securities (MBS), and short-maturity investment grade corporates) are currently more attractive than plus sectors (high-yield bonds and non-U.S. sectors) with the exception of preferred securities, which look attractive after having sold off due to stresses in the banking system.
On the equity side, we do not expect the U.S. debt situation to cause the type of market volatility experienced in 2011. But LPL Research believes stocks have moved a bit past what is justified by fundamentals in the short term and a 5-10% pullback is overdue.
Overall, LPL’s Strategic and Tactical Asset Allocation Committee (STAAC) recommends a neutral tactical allocation to equities, with a modest overweight to fixed income funded from cash. Within equities, the STAAC recommends being neutral on style, favors developed international equities over emerging markets and large caps over small, and maintains the industrials sector as its top overall sector pick.
IMPORTANT DISCLOSURES
This material is for general information only and is not intended to provide specific advice or recommendations for any individual. There is no assurance that the views or strategies discussed are suitable for all investors or will yield positive outcomes. Investing involves risks including possible loss of principal. Any economic forecasts set forth may not develop as predicted and are subject to change.
References to markets, asset classes, and sectors are generally regarding the corresponding market index. Indexes are unmanaged statistical composites and cannot be invested into directly. Index performance is not indicative of the performance of any investment and do not reflect fees, expenses, or sales charges. All performance referenced is historical and is no guarantee of future results.
Any company names noted herein are for educational purposes only and not an indication of trading intent or a solicitation of their products or services. LPL Financial doesn’t provide research on individual equities.
All information is believed to be from reliable sources; however, LPL Financial makes no representation as to its completeness or accuracy.
US Treasuries may be considered “safe haven” investments but do carry some degree of risk including interest rate, credit, and market risk. Bonds are subject to market and interest rate risk if sold prior to maturity. Bond values will decline as interest rates rise and bonds are subject to availability and change in price.
Preferred stock dividends are paid at the discretion of the issuing company. Preferred stocks are subject to interest rate and credit risk. As interest rates rise, the price of the preferred falls (and vice versa). They may be subject to a call feature with changing interest rates or credit ratings.
Mortgage backed securities are subject to credit, default, prepayment, extension, market and interest rate risk.
Bonds are subject to market and interest rate risk if sold prior to maturity. Bond values will decline as interest rates rise and bonds are subject to availability and change in price.
The Standard & Poor’s 500 Index (S&P500) is a capitalization-weighted index of 500 stocks designed to measure performance of the broad domestic economy through changes in the aggregate market value of 500 stocks representing all major industries.
The PE ratio (price-to-earnings ratio) is a measure of the price paid for a share relative to the annual net income or profit earned by the firm per share. It is a financial ratio used for valuation: a higher PE ratio means that investors are paying more for each unit of net income, so the stock is more expensive compared to one with lower PE ratio.
Earnings per share (EPS) is the portion of a company’s profit allocated to each outstanding share of common stock. EPS serves as an indicator of a company’s profitability. Earnings per share is generally considered to be the single most important variable in determining a share’s price. It is also a major component used to calculate the price-to-earnings valuation ratio.
All index data from FactSet.
Value investments can perform differently from the market as a whole. They can remain undervalued by the market for long periods of time.
The prices of small cap stocks are generally more volatile than large cap stocks.
International investing involves special risks such as currency fluctuation and political instability and may not be suitable for all investors. These risks are often heightened for investments in emerging markets.
LPL Financial does not provide investment banking services and does not engage in initial public offerings or merger and acquisition activities.
This research material has been prepared by LPL Financial LLC.
This research material has been prepared by LPL Financial LLC. Securities and advisory services offered through LPL Financial (LPL), a registered investment advisor and broker-dealer (member FINRA/SIPC). Insurance products are offered through LPL or its licensed affiliates. To the extent you are receiving investment advice from a separately registered independent investment advisor that is not an LPL affiliate, please note LPL makes no representation with respect to such entity.
Not Insured by FDIC/NCUA or Any Other Government Agency | Not Bank/Credit Union Guaranteed | Not Bank/Credit Union Deposits or Obligations | May Lose Value
RES-1606901-0723 | For Public Use | Tracking # 1-05377337 (Exp. 08/2024)
For a list of descriptions of the indexes referenced in this publication, please visit our website at lplresearch.com/definitions